 RGO
RGO
RTO, Admission Document, GM Notice & Restoration
RiverFort Global Opportunities PLC
AI-powered RNS digestion, live interactive charts, insider flow and broker targets — all in your pocket.
Market AI
619 headlines · 25 AI picks today
Tap a ticker to open AI chart · Ask AI above
--
AI
BTC structure, AI forecast, macro event odds and listed crypto-beta names blended into one mobile cockpit.
 RGO
RGO
RiverFort Global Opportunities PLC
 IPO
IPO
IP Group
 ANTO
ANTO
Antofagasta PLC
 FEV
FEV
Fidelity European Values
 FSFL
FSFL
Foresight Solar Fund Ltd
 ROO
ROO
Deliveroo Holdings PLC
 BARC
BARC
Barclays PLC
 SMWH
SMWH
WH Smith PLC
ROO
Deliveroo Holdings PLC
 BEZ
BEZ
Beazley plc
 JD.
JD.
JD.
 IMB
IMB
Imperial Brands PLC
 LGEN
LGEN
Legal & General Group PLC
 IMI
IMI
IMI PLC
 33JE
33JE
33JE
 SPT
SPT
Spirent Communications plc
 DRX
DRX
Drax Group PLC
 MER
MER
Mears Group plc
 THRG
THRG
Throgmorton Trust Plc
 CORO
CORO
Coro Energy PLC
 PSON
PSON
Pearson PLC
 BRGE
BRGE
BlackRock Greater Europe Investment Trust plc
FSFL
Foresight Solar Fund Ltd
 BNKR
BNKR
Bankers Investment Trust
 SMIN
SMIN
Smiths Group PLC
 SSON
SSON
Smithson Investment Trust PLC
 JUP
JUP
Jupiter Fund Management Plc
 HSBA
HSBA
HSBC Holdings PLC
 EDV
EDV
Endeavour Mining Corp
 ABF
ABF
Associated British Foods PLC
 XGLD
XGLD
Xtrackers Physical Gold ETC
 JDG
JDG
Judges Scientific Plc
 CTY
CTY
City Of London Investment Trust
 TXP
TXP
Touchstone Exploration Inc
 SHRS
SHRS
Shires Income
 CVSG
CVSG
CVS Group Plc
 AHT
AHT
Ashtead Group PLC
 OXA1
OXA1
Db Etc Plc
 DIG
DIG
Dunedin Income Growth Investment Trust PLC
 AUSC
AUSC
Abrdn UK Smaller Companies Growth Trust PLC
 ANII
ANII
Aberdeen New India Investment Trust PLC
 AAIF
AAIF
abrdn Asian Income Fund Limited
 PPH
PPH
PPHE Hotel Group Ltd
 BRWM
BRWM
Blackrock World Mining Trust Plc
 AAS
AAS
Abrdn Asia Focus PLC
 BGEO
BGEO
Lion Finance Group PLC
 LLOY
LLOY
Lloyds Banking Group PLC
 ADIG
ADIG
Aberdeen Diversified Income and Growth Trust PLC
33JE
33JE
 GSK
GSK
GSK plc
 LWI
LWI
Lowland Investment Co
 FAS
FAS
Fidelity Asian Values
 MTU
MTU
Montanaro UK Smaller Companies Investment Trust PLC
 JAGI
JAGI
JPMorgan Asia Growth & Income plc
 IEM
IEM
Impax Environmental Markets PLC
 ALW
ALW
Alliance Witan Ord
 IAD
IAD
Invesco Asia Dragon Trust plc
 SST
SST
The Scottish Oriental Smaller Companies Trust plc
 JEDT
JEDT
JPMorgan Euro Small Companies Trust Plc
 HSL
HSL
Henderson Smaller Cos Inv Tst
 PGH
PGH
Personal Group Holdings PLC
 BHMG
BHMG
BH Macro Limited
 JMG
JMG
JPMorgan Emerging Markets Ord
 PCT
PCT
Polar Capital Technology Trust
 0RYA
0RYA
Ryanair Holdings plc
 MNL
MNL
Manchester and London Investment Trust plc
 JAM
JAM
JPMorgan American Investment Trust
 SHEL
SHEL
Shell plc
 PAG
PAG
Paragon Banking Group PLC
 BGUK
BGUK
Baillie Gifford UK Growth Fund PLC
 CTUK
CTUK
CT UK Capital And Income Investment Trust Plc
 PAC
PAC
Pacific Assets Trust plc
 NCYF
NCYF
CQS New City High Yield Fund
 BGS
BGS
Baillie Gifford Shin Nippon PLC
 REL
REL
Relx PLC
 JEMI
JEMI
JPMorgan Global Emerging Markets Investment Trust PLC
 TEM
TEM
Templeton Emerging Markets Investment Trust TEMIT
 SEC
SEC
Strategic Equity Capital Closed Fund
 GSCT
GSCT
The Global Smaller Companies Trust Plc
 SREI
SREI
Schroder Real Estate Investment Trust Ltd
 FEML
FEML
Fidelity Emerging Markets Ord
 CGT
CGT
Capital Gearing Trust
 MONY
MONY
MONY Group plc
 UPL
UPL
Upland Resources Ltd
 EWI
EWI
Edinburgh Worldwide Investment Trust plc
 CRH
CRH
CRH PLC
 FCH
FCH
Funding Circle Holdings PLC
 MPAC
MPAC
MPAC Group PLC
 HWDN
HWDN
Howden Joinery Group Plc
 JUSC
JUSC
JPmorgan US Smaller Companies Investment Trust PLC
 EPWN
EPWN
Epwin Group PLC
 SMT
SMT
Scottish Mortgage Investment Trust plc
 HFEL
HFEL
Henderson Far East Income Ltd
 MNKS
MNKS
Monks Investment Trust PLC
 UEM
UEM
Utilico Emerging Markets Ltd
 BGFD
BGFD
Baillie Gifford Japan Trust
 RKT
RKT
Reckitt Benckiser Group PLC
 MAI
MAI
Maintel Holdings Plc
 CRTA
CRTA
Cirata plc
 88E
88E
88 Energy Ltd
 STJ
STJ
St. Jamess Place plc
 LTOD
LTOD
Larsen & Toubro Limited
 ABDN
ABDN
Abrdn PLC
 HIK
HIK
Hikma Pharmaceuticals PLC
 51DV
51DV
51DV
 VSL
VSL
VPC Specialty Lending Investments PLC
 SYNC
SYNC
Syncona Limited
 LSL
LSL
LSL Property Services Plc
 OAP3
OAP3
Octopus Apollo VCT PLC
 CMPG
CMPG
CT Global Managed Portfolio Trust PLC
OAP3
Octopus Apollo VCT PLC
 CMPI
CMPI
CT Global Managed Portfolio Trust PLC
 NAIT
NAIT
The North American Income Trust plc
 SORT
SORT
Sorted Group Holdings Plc
 MIRI
MIRI
Mirriad Advertising PLC
 OIT
OIT
Odyssean Investment Trust PLC
 CRN
CRN
Cairn Homes PLC
 CSSG
CSSG
Croma Security Solutions Group Plc
 MNDI
MNDI
Mondi PLC
 IRSH
IRSH
IRSH
 GBG
GBG
GB Group plc
 JUST
JUST
Just Group plc
IRSH
IRSH
 WIX
WIX
Wickes Group PLC
 FCIT
FCIT
F&C Investment Trust PLC
FCIT
F&C Investment Trust PLC
BARC
Barclays PLC
FCIT
F&C Investment Trust PLC
 ICGC
ICGC
Irish Continental Group plc
 71LF
71LF
71LF
GSK
GSK plc
 TRN
TRN
Trainline Plc
 IHG
IHG
InterContinental Hotels Group PLC
 HAN
HAN
Hansa Trust
HAN
Hansa Trust
 0QZ3
0QZ3
Qualcomm Inc.
 AWE
AWE
Alphawave IP Group PLC
SPT
Spirent Communications plc
 DWL
DWL
Dowlais Group Plc
 DLG
DLG
Direct Line Insurance Group plc
 AV.
AV.
AV.
DWL
Dowlais Group Plc
 RWI
RWI
Renewi PLC
DWL
Dowlais Group Plc
 HRI
HRI
Herald Investment Trust
OIT
Odyssean Investment Trust PLC
 SWR
SWR
Smurfit Westrock Plc
 HSW
HSW
Hostelworld Group PLC
BARC
Barclays PLC
SPT
Spirent Communications plc
BARC
Barclays PLC
BARC
Barclays PLC
BARC
Barclays PLC
BARC
Barclays PLC
AAIF
abrdn Asian Income Fund Limited
RWI
Renewi PLC
DWL
Dowlais Group Plc
SPT
Spirent Communications plc
BARC
Barclays PLC
 CCR
CCR
C&C Group plc
 GFTU
GFTU
Grafton Group plc
 QLT
QLT
Quilter PLC
QLT
Quilter PLC
QLT
Quilter PLC
 CHI
CHI
CT UK High Income Ord
AV.
AV.
RWI
Renewi PLC
AV.
AV.
 FDM
FDM
FDM Group Holdings PLC
DLG
Direct Line Insurance Group plc
 GOT
GOT
Global Opportunities Trust Ord
DWL
Dowlais Group Plc
BARC
Barclays PLC
BARC
Barclays PLC
BARC
Barclays PLC
BARC
Barclays PLC
BARC
Barclays PLC
BARC
Barclays PLC
 SE77
SE77
SE77
 RAT
RAT
Rathbone Brothers PLC
RAT
Rathbone Brothers PLC
RAT
Rathbone Brothers PLC
0QZ3
Qualcomm Inc.
 FLTR
FLTR
Flutter Entertainment PLC
RAT
Rathbone Brothers PLC
DLG
Direct Line Insurance Group plc
 BNZL
BNZL
Bunzl PLC
AV.
AV.
DWL
Dowlais Group Plc
 TRIG
TRIG
Renewables Infrastructure Grp
BARC
Barclays PLC
 BAKK
BAKK
Bakkavor Group PLC
RAT
Rathbone Brothers PLC
 LMP
LMP
LondonMetric Property Plc
RAT
Rathbone Brothers PLC
 STAN
STAN
Standard Chartered PLC
 SHED
SHED
Urban Logistics Reit PLC
RAT
Rathbone Brothers PLC
 INDV
INDV
Indivior PLC
LMP
LondonMetric Property Plc
RAT
Rathbone Brothers PLC
JUP
Jupiter Fund Management Plc
 CRT
CRT
Care REIT plc
ROO
Deliveroo Holdings PLC
 WHR
WHR
Warehouse REIT plc
 FEN
FEN
Frenkel Topping Group
DWL
Dowlais Group Plc
STAN
Standard Chartered PLC
 ITX
ITX
Itaconix plc
BAKK
Bakkavor Group PLC
BARC
Barclays PLC
SPT
Spirent Communications plc
 GNC
GNC
Greencore Group
AV.
AV.
BARC
Barclays PLC
 UPR
UPR
Uniphar Group PLC
 JDW
JDW
J D Wetherspoon PLC
 SCP
SCP
Schroder UK Mid Cap Fund PLC
RAT
Rathbone Brothers PLC
IRSH
IRSH
INDV
Indivior PLC
LSL
LSL Property Services Plc
 AIRE
AIRE
Alternative Income REIT PLC
 HBR
HBR
Harbour Energy PLC
IRSH
IRSH
BARC
Barclays PLC
 MNG
MNG
M&G Plc
 JGGI
JGGI
JP Morgan Global Growth & Income PLC
 DAL
DAL
Dalata Hotel Group plc
 MAV4
MAV4
Maven Income and Growth VCT 4 PLC
 BFSP
BFSP
Blackfinch Spring VCT PLC
IRSH
IRSH
 FE80
FE80
FE80
IRSH
IRSH
 TSCO
TSCO
Tesco PLC
 BOOM
BOOM
Audioboom Group plc
BARC
Barclays PLC
 MRL
MRL
Marlowe plc
BARC
Barclays PLC
 LAND
LAND
Land Securities Group PLC
SPT
Spirent Communications plc
 MGAM
MGAM
Morgan Advanced Materials plc
 PAF
PAF
Pan African Resources PLC
 NG.
NG.
NG.
 BATS
BATS
British American Tobacco PLC
BATS
British American Tobacco PLC
 0UKI
0UKI
Bank of Nova Scotia
BARC
Barclays PLC
BARC
Barclays PLC
BARC
Barclays PLC
BARC
Barclays PLC
BARC
Barclays PLC
BARC
Barclays PLC
 CGEO
CGEO
Georgia Capital PLC
 CNA
CNA
Centrica PLC
 SOS
SOS
Sosandar Plc
IMI
IMI PLC
 GYM
GYM
The GYM Group PLC
IRSH
IRSH
IRSH
IRSH
 CAU
CAU
Centaur Media
 PODP
PODP
Pod Point Group Holdings PLC
 PEN
PEN
Pennant International Group plc
 TGA
TGA
Thungela Resources Limited
 MGCI
MGCI
M&G Credit Income Investment Trust PLC
 94WF
94WF
94WF
 OSB
OSB
OneSavings Bank PLC
RAT
Rathbone Brothers PLC
 BOWL
BOWL
Hollywood Bowl Group PLC
 ELIX
ELIX
Elixirr International Plc
94WF
94WF
 ROSE
ROSE
Rosebank Industries PLC
 0NVC
0NVC
Danske Bank A/S
PPH
PPHE Hotel Group Ltd
 NLB
NLB
Nova Ljubljanska Banka d.d.
 GENL
GENL
Genel Energy Plc
BATS
British American Tobacco PLC
FLTR
Flutter Entertainment PLC
 BBY
BBY
Balfour Beatty plc
 RWS
RWS
RWS Holdings PLC
 HKLD
HKLD
HONGKONG LAND HLDGS
 ALPH
ALPH
Alpha Group International plc
 IXI
IXI
IXICO PLC
 YZ61
YZ61
YZ61
YZ61
YZ61
 POLR
POLR
Polar Capital Holdings plc
ABDN
Abrdn PLC
RAT
Rathbone Brothers PLC
GSK
GSK plc
IRSH
IRSH
IRSH
IRSH
JDW
J D Wetherspoon PLC
 BRK
BRK
Brooks Macdonald Group
STAN
Standard Chartered PLC
 SPX
SPX
Spirax Group plc
 87FZ
87FZ
AECI Ltd
 IDS
IDS
International Distributions Services PLC
QLT
Quilter PLC
 BBB
BBB
Bigblu Broadband PLC
 JAR
JAR
Jardine Matheson Holdings Limited
HIK
Hikma Pharmaceuticals PLC
 HHPD
HHPD
Hon Hai Precision Industry Co Ltd ADR
IRSH
IRSH
IRSH
IRSH
 CTG
CTG
Christie Group plc
 XGDU
XGDU
Xtrackers IE Physical Gold ETC
IRSH
IRSH
 SDV
SDV
Chelverton UK Dividend Trust PLC
IRSH
IRSH
IRSH
IRSH
IRSH
IRSH
 SYM
SYM
Symphony Environmental Technologies plc
 0Q0J
0Q0J
0Q0J
 DFCH
DFCH
Distribution Finance Capital Holdings PLC
 SDR
SDR
Schroders PLC
 JEGI
JEGI
JPMorgan European Growth & Income plc
MONY
MONY Group plc
 SF22
SF22
SF22
 INVP
INVP
Investec PLC
 PRU
PRU
Prudential plc
 ALFA
ALFA
Alfa Financial Software Holdings PLC
INVP
Investec PLC
 LUCE
LUCE
Luceco plc
 3IN
3IN
3I Infrastructure PLC
PRU
Prudential plc
3IN
3I Infrastructure PLC
INVP
Investec PLC
 REVB
REVB
Revolution Beauty Group PLC
UPR
Uniphar Group PLC
INVP
Investec PLC
INVP
Investec PLC
 ACID
ACID
Acer Incorporated
CNA
Centrica PLC
 GABI
GABI
Project Finance Investments Limited
AV.
AV.
 GCL
GCL
Geiger Counter Limited
 NWOR
NWOR
National World PLC
CRH
CRH PLC
HSW
Hostelworld Group PLC
 EKF
EKF
EKF Diagnostics Holdings Plc
ANTO
Antofagasta PLC
 TYT
TYT
Toyota Motor Corp
HHPD
Hon Hai Precision Industry Co Ltd ADR
 KNM
KNM
Konami Holdings Corp
KNM
Konami Holdings Corp
KNM
Konami Holdings Corp
 MGNS
MGNS
Morgan Sindall Group PLC
IRSH
IRSH
 UFO
UFO
Alien Metals Ltd
 AVAP
AVAP
Avation PLC
IRSH
IRSH
HIK
Hikma Pharmaceuticals PLC
TYT
Toyota Motor Corp
TYT
Toyota Motor Corp
TYT
Toyota Motor Corp
 ZOO
ZOO
Zoo Digital Group Plc
| Year | Revenue | EBITDA | Net Cash | Cost Savings |
|---|---|---|---|---|
| FY25 | $49.4 million | At least $0.1 million | $2.6 million | $6.8 million |
| FY24 | N/A | Loss of $13.6 million | N/A | N/A |
TYT
Toyota Motor Corp
YZ61
YZ61
YZ61
YZ61
YZ61
YZ61
 AVCT
AVCT
Avacta Group PLC
BARC
Barclays PLC
 RBD
RBD
Reabold Resources Plc
 PCTN
PCTN
Picton Property Income Ltd
 0A3F
0A3F
0A3F
 0A3D
0A3D
iShares VII Public Limited Company - iShares Core S&P 500 UCITS ETF
 0A3E
0A3E
0A3E
 0A3G
0A3G
0A3G
 CMB1
CMB1
iShares FTSE MIB UCITS
BBY
Balfour Beatty plc
 KMK
KMK
Kromek Group PLC
 IAG
IAG
International Consolidated Airlines Group S.A
 TRST
TRST
Trustpilot Group PLC
MGAM
Morgan Advanced Materials plc
ZOO
Zoo Digital Group Plc
 PU26
PU26
PU26
 DEC
DEC
Diversified Energy Company PLC
FLTR
Flutter Entertainment PLC
 IWG
IWG
IWG PLC
 CHRY
CHRY
Chrysalis Investments Ltd
 GROW
GROW
Draper Esprit PLC
GENL
Genel Energy Plc
 CREI
CREI
Custodian REIT PLC
 RM.
RM.
RM.
 MTRO
MTRO
Metro Bank PLC
CRN
Cairn Homes PLC
| Year | Revenue Growth | Operating Profit | ROE | Debt |
|---|---|---|---|---|
| 2025 | In excess of 10% | €160 million | c.15.5% | Not mentioned |
| 2024 | Not mentioned | Not mentioned | Not mentioned | Not mentioned |
 APAX
APAX
Apax Global Alpha Ltd
 TIA
TIA
Tialis Essential IT PLC
 INSG
INSG
Insig Ai PLC
 KETL
KETL
Strix Group Plc
 SAV
SAV
Savannah Resources Plc
 SSIT
SSIT
Seraphim Space Investment Trust PLC
 ANIC
ANIC
Agronomics Ltd
JUSC
JPmorgan US Smaller Companies Investment Trust PLC
MNL
Manchester and London Investment Trust plc
 FAB
FAB
Fusion Antibodies PLC
 ENSI
ENSI
EnSilica PLC
 MTEC
MTEC
Made Tech Group PLC
 OBI
OBI
Ondine Biomedical Inc
 HGT
HGT
HG Capital Trust PLC
SREI
Schroder Real Estate Investment Trust Ltd
 LIKE
LIKE
Likewise Group PLC
 EGY
EGY
VAALCO Energy Inc
 BIG
BIG
Big Technologies PLC
 SPEC
SPEC
Inspecs Group plc
 ROAD
ROAD
Roadside Real Estate plc
 BBH
BBH
Bellevue Healthcare Trust PLC
 BBOX
BBOX
Tritax Big Box REIT plc
GFTU
Grafton Group plc
 GTC
GTC
Getech Group
 BSRT
BSRT
Baker Steel Resources Trust
 DNLM
DNLM
Dunelm Group PLC
 CTA
CTA
CT Automotive Group PLC
 TBCG
TBCG
TBC Bank Group PLC
 SUOP
SUOP
iShares $ Corp Bond ESG UCITS ETF GBP Hedged Inc
 DHYG
DHYG
iShares $ High Yield Corp Bond ESG UCITS ETF GBP Hedged Dist
 EMES
EMES
iShares J.P. Morgan ESG $ EM Bond UCITS ETF USD (Dist)
 SUOG
SUOG
iShares € Corp Bond ESG UCITS ETF GBP Hedged Inc
 SUOE
SUOE
iShares € Corp Bond ESG UCITS ETF EUR (Dist)
 EFRN
EFRN
iShares € Floating Rate Bond ESG UCITS ETF EUR (Dist)
 FLOS
FLOS
iShares $ Floating Rate Bond UCITS ETF
 FLOT
FLOT
iShares II Public Limited Company - iShares $ Floating Rate Bond UCITS ETF
 WQDV
WQDV
iShares MSCI World Quality Dividend ESG UCITS ETF USD (Dist)
 TI5G
TI5G
iShares $ TIPS 0-5 UCITS ETF GBP Hedged (Dist)
 TIP5
TIP5
iShares $ TIPS 0-5 UCITS Dist Share Class
 SGSU
SGSU
iShares $ Corp Bond 0-3yr ESG UCITS ETF GBP Hedged (Dist)
 SUSU
SUSU
iShares $ Corp Bond SRI 0-3yr UCITS ETF USD (Dist)
 QDIV
QDIV
iShares MSCI USA Dividend IQ UCITS
 IUGA
IUGA
iShares US Aggregate Bond UCITS ETF
 IUAG
IUAG
iShares US Aggregate Bond UCITS ETF USD (Dist)
 IHHG
IHHG
iShares $ High Yield Corp Bond UCITS ETF GBP Hedged (Dist)
 IHYU
IHYU
iShares High Yield Corporate Bond UCITS
 DLTM
DLTM
iShares II Public Limited Company - iShares MSCI EM Latin America UCITS ETF
 DPYG
DPYG
iShares Developed Markets Property Yield UCITS ETF GBP Hedged (Dist)
 IDWP
IDWP
iShares Developed Markets Property Yield UCITS
 IDUP
IDUP
iShares US Property Yield UCITS ETF USD (Dist)
 IUKP
IUKP
iShares UK Property UCITS
 ITPG
ITPG
iShares II Public Limited Company - iShares $ TIPS UCITS ETF
 IDTK
IDTK
iShares MSCI Turkey UCITS ETF USD (Dist)
 ISDW
ISDW
iShares MSCI World Islamic UCITS
 ISDU
ISDU
iShares MSCI USA Islamic UCITS
 ISDE
ISDE
iShares MSCI Emerging Markets Islamic UCITS
 IDPE
IDPE
iShares Listed Private Equity UCITS ETF USD (Dist)
 INXG
INXG
iShares £ Index-Linked Gilts UCITS ETF GBP (Dist)
 IDIN
IDIN
iShares Global Infrastructure UCITS ETF USD (Dist)
 DH2O
DH2O
iShares Global Water UCITS
 IGLT
IGLT
iShares Core UK Gilts UCITS
 EMHG
EMHG
iShares J.P. Morgan $ EM Bond UCITS ETF GBP Hedged (Dist)
 IEMB
IEMB
iShares J.P. Morgan $ EM Bond UCITS ETF USD (Dist)
 IGTM
IGTM
iShares $ Treasury Bond 7-10yr UCITS ETF USD
 DBRC
DBRC
iShares BRIC 50 UCITS
 IDTM
IDTM
iShares II Public Limited Company - iShares $ Treasury Bond 7-10yr UCITS ETF
 IBGM
IBGM
iShares Euro Government Bond 7-10yr UCITS ETF EUR (Dist)
 IDAR
IDAR
iShares Asia Property Yield UCITS ETF USD (Dist) USD
 EMBE
EMBE
iShares J.P. Morgan Emerging Markets Bond EUR Hedged UCITS
 AAF
AAF
Airtel Africa Plc
| Year | Revenue | Operating Profit | Profit/Loss After Tax | EPS (Basic) | Capex | Net Debt | Leverage |
|---|---|---|---|---|---|---|---|
| 2025 | $4,955m | $1,457m | $328m | 6.0 cents | $670m | $5,363m | 2.3x |
| 2024 | $4,979m | $1,640m | $(89)m | (4.4) cents | $737m | $3,505m | 1.4x |
 MTL
MTL
Metals Exploration Plc
TXP
Touchstone Exploration Inc
 WSBN
WSBN
Wishbone Gold Plc
 0A28
0A28
Prosus N.V.
 PEY
PEY
Princess Private Equity Holding Ltd
 MSMN
MSMN
Mosman Oil and Gas Ltd
STAN
Standard Chartered PLC
FLTR
Flutter Entertainment PLC
| Financial Metrics | Q1 2025 | Q1 2024 | YoY Change | ||||
|---|---|---|---|---|---|---|---|
| Amount | % | Amount | % | % | |||
| Average Monthly Players (AMPs) | 14,880 | 13,722 | +8% | ||||
| Revenue | $3,665 million | $3,397 million | +8% | ||||
| Net Income | $335 million | $(177) million | +289% | ||||
| Net Income Margin | 9.1% | (5.2)% | +1,440 bps | ||||
| Adjusted EBITDA | $616 million | $514 million | +20% | ||||
| Adjusted EBITDA Margin | 16.8% | 15.1% | +170 bps | ||||
| Earnings per Share | $1.57 | $(1.10) | +243% | ||||
| Adjusted Earnings per Share | $1.59 | $1.05 | +51% | ||||
| Net Cash from Operating Activities | $188 million | $337 million | (44)% | ||||
| Free Cash Flow | $88 million | $185 million | (52)% | ||||
 BEM
BEM
Beowulf Mining
 AIBG
AIBG
AIB Group PLC
 PTAL
PTAL
Petrotal Corp
 CNC
CNC
Concurrent Technologies Plc
 PULS
PULS
Pulsar Group plc
 TRCS
TRCS
Tracsis Plc
HBR
Harbour Energy PLC
KMK
Kromek Group PLC
| Full Year 2025 | Full Year 2024 | |
|---|---|---|
| Revenue | Not less than £26 million | N/A |
| Year-on-Year Revenue Growth | At least 34% growth | N/A |
| Profit Before Tax | Slightly ahead of market expectations | N/A |
| Group Debt | £0.5 million | £12.3 million |
MIRI
Mirriad Advertising PLC
 CCEP
CCEP
Coca-Cola Europacific Partners PLC
IMI
IMI PLC
| Financial Metric | 2025 | 2024 | Change |
|---|---|---|---|
| Group Organic Revenue | 3% lower | N/A | N/A |
| Adjusted Revenue | 5% lower | N/A | N/A |
| Group Margins | Improved | N/A | N/A |
| Automation Revenue | 4% lower | N/A | N/A |
| Process Automation Revenue | 1% lower | 27% growth | Negative Change |
| Process Automation Orders | 7% increase | N/A | N/A |
| Aftermarket Orders | 19% increase | N/A | N/A |
| Industrial Automation Revenue | 7% lower | N/A | N/A |
| Life Technology Revenue | 2% lower | N/A | N/A |
| Climate Control Revenue | 4% higher | N/A | N/A |
| Life Science and Fluid Control Revenue | Flat | N/A | N/A |
| Transport Revenue | 16% lower | 19% growth | Negative Change |
| Adjusted Basic Earnings per Share CAGR | 11% | N/A | N/A |
| Amount Returned to Shareholders | £650m | N/A | N/A |
| Share Buyback | £200m | N/A | N/A |
| Impact of Exchange Rates on Revenue and Adjusted Operating Profit | 2% negative impact | N/A | N/A |
| Full Year Adjusted EPS Guidance | 129p-136p | N/A | N/A |
| Weighted Average Number of Shares | Around 249 million | N/A | N/A |
 GEX
GEX
Georgina Energy PLC
 SFOR
SFOR
S4 Capital PLC
| Financial Metrics | Q1 2025 | Change Reported | Change Like-for-Like | Change Pro-forma | Q1 2024 |
|---|---|---|---|---|---|
| Billings | £463.3 million | 7.7% | 8.6% | 8.6% | £430.1 million |
| Revenue | £178.1 million | -15.3% | -14.3% | -14.3% | £210.2 million |
| Net Revenue | £163.7 million | -12.2% | -11.4% | -11.4% | £186.4 million |
| Net Debt | £144.8 million | N/A | N/A | N/A | £206.0 million |
| Net Revenue by Segment | Q1 2025 | Change Reported | Change Like-for-Like | Q1 2024 |
|---|---|---|---|---|
| Marketing Services | £148.3 million | -8.6% | -7.5% | £162.2 million |
| Technology Services | £15.4 million | -36.4% | -36.9% | £24.2 million |
| Net Revenue by Geography | Q1 2025 | Change Reported | Change Like-for-Like | Q1 2024 |
|---|---|---|---|---|
| Americas | £130.5 million | -11.0% | -10.5% | £146.7 million |
| EMEA | £24.3 million | -17.3% | -15.9% | £29.4 million |
| Asia-Pacific | £8.9 million | -13.6% | -11.0% | £10.3 million |
 FRP
FRP
Frp Advisory Group Plc
 CNE
CNE
Capricorn Energy PLC
 GEM
GEM
Gemfields Plc
CHRY
Chrysalis Investments Ltd
CNA
Centrica PLC
 AREC
AREC
Arecor Therapeutics PLC
IHG
InterContinental Hotels Group PLC
 GST
GST
GSTechnologies Ltd
 SBDS
SBDS
Silver Bullet Data Services Group PLC
 LORD
LORD
Lords Grp Trading Plc
| Year | Revenue | Adjusted EBITDA | Adjusted Operating Profit | Net Debt |
|---|---|---|---|---|
| 2024 | £436.7m | £22.4m | £10.4m | £32.4m |
| 2023 | £462.6m | £26.8m | £16.5m | £28.5m |
| Change | (5.6)% | (16.5)% | (37.0)% | +13.5% |
 OCI
OCI
Oakley Capital Investments Limited
 MXCT
MXCT
MaxCyte Inc
| Financial Metric | Q1 2025 | Q1 2024 | Change |
|---|---|---|---|
| Total Revenue | $10.4 million | $11.3 million | -8% |
| Core Business Revenue | $8.2 million | $8.2 million | 1% |
| SPL Program-related Revenue | $2.1 million | $3.2 million | -32% |
| Gross Profit | $8.9 million | $9.9 million | N/A |
| Gross Margin | 86% | 88% | N/A |
| Operating Expenses | $21.2 million | $22.2 million | N/A |
| Net Loss | $10.3 million | $9.5 million | N/A |
| EBITDA | Loss of $11.2 million | Loss of $11.2 million | N/A |
| Cash, Cash Equivalents, and Investments | $174.7 million | N/A | N/A |
3IN
3I Infrastructure PLC
| Year | Total Return | Total Income | Total Liquidity | Net Debt |
|---|---|---|---|---|
| 2025 | £333m | £204m | £644m | £256m |
| 2024 | £347m | £194m | £395m | £505m |
APAX
Apax Global Alpha Ltd
 VOD
VOD
Vodafone Group PLC
 HTWS
HTWS
Helios Towers Plc
| Financial Metrics | Q1 2025 | Q1 2024 | Change | Q1 2025 | Q4 2024 | Change |
|---|---|---|---|---|---|---|
| Sites | 14,417 | 14,166 | +2% | 14,417 | 14,325 | +1% |
| Tenancies | 30,074 | 27,686 | +9% | 30,074 | 29,406 | +2% |
| Tenancy Ratio | 2.09x | 1.95x | +0.14x | 2.09x | 2.05x | +0.04x |
| Revenue (US$m) | 203.8 | 194.6 | +5% | 203.8 | 207.3 | -2% |
| Adjusted EBITDA (US$m) | 111.1 | 102.2 | +9% | 111.1 | 109.1 | +2% |
| Adjusted EBITDA Margin | 55% | 53% | +2ppt | 55% | 53% | +2ppt |
| Operating Profit (US$m) | 76.6 | 67.3 | +14% | 76.6 | 51.7 | +48% |
| ROIC | 13.8% | 12.6% | +1.2ppt | 13.8% | 12.9% | +0.9ppt |
| Free Cash Flow (US$m) | 1.5 | -27.7 | +29.2 | 1.5 | 39.8 | -38.3 |
| Net Debt (US$m) | 1,768.5 | 1,812.1 | -2% | 1,768.5 | 1,735.5 | +2% |
| Net Leverage | 4.0x | 4.4x | -0.4x | 4.0x | 4.0x | 0 |
 ULVR
ULVR
Unilever PLC
 EMG
EMG
Man Group PLC
 TUN
TUN
Tungsten West PLC
 KGF
KGF
Kingfisher PLC
 HLN
HLN
Haleon PLC
DFCH
Distribution Finance Capital Holdings PLC
 CPP
CPP
CPPGroup Plc
 HSX
HSX
Hiscox Ltd
 PAY
PAY
PayPoint plc
 POLX
POLX
Polarean Imaging Plc
| Financial Metrics | FY 2023 | FY 2024 | Change |
|---|---|---|---|
| Revenue | $890,933 | $3,089,957 | 246.9% |
| Cost of Sales | $555,450 | $1,666,667 | 201.0% |
| Gross Profit | $335,483 | $1,423,290 | 324.2% |
| Administrative Expenses | $3,337,836 | $3,102,331 | -7.1% |
| Research, Development & Regulatory Expenses | $4,194,006 | $3,440,590 | -17.9% |
| Depreciation | $208,786 | $254,993 | 22.1% |
| Amortization | $728,411 | $710,058 | -2.5% |
| Selling & Distribution Expenses | $3,562,412 | $1,950,755 | -45.2% |
| Share-Based Payment Expense | $860,195 | $713,895 | -17.0% |
| Total Operating Costs | $12,891,646 | $10,172,622 | -21.1% |
| Operating Loss | $12,556,163 | $8,749,332 | -30.3% |
| Finance Income | $298,899 | $274,838 | -8.0% |
| Finance Expense | $15,990 | $16,178 | 1.1% |
| Other Losses/Gains - Net | $388,451 | $(49,300) | -113.4% |
| Loss Before Tax | $11,884,803 | $8,539,972 | -28.1% |
| Taxation | $0 | $0 | 0.0% |
| Loss for the Year | $11,884,803 | $8,539,972 | -28.1% |
| Net Cash | $6,171,636 | $12,111,708 | 96.2% |
| Debt | FY 2023 | FY 2024 | Change |
|---|---|---|---|
| Lease Liability (Non-Current) | $74,846 | $374,265 | 400.5% |
| Trade & Other Payables (Non-Current) | $240,000 | $120,000 | -50.0% |
| Contract Liabilities (Non-Current) | $67,032 | $56,771 | -15.3% |
| Total Non-Current Debt | $381,878 | $551,036 | 44.2% |
| Lease Liability (Current) | $141,845 | $129,521 | -8.7% |
| Trade & Other Payables (Current) | $1,831,587 | $2,702,879 | 47.5% |
| Contract Liabilities (Current) | $228,878 | $266,265 | 16.3% |
| Total Current Debt | $2,202,310 | $3,098,665 | 40.7% |
| Total Debt | $2,584,188 | $3,650,601 | 41.2% |
IAG
International Consolidated Airlines Group S.A
 PLUS
PLUS
Plus500 Ltd
GFTU
Grafton Group plc
| Financial Year | Revenue (£ million) | Average Daily Like-for-Like Revenue Change | Debt |
|---|---|---|---|
| 2025 | £773.1 million | 2.7% increase | Not mentioned |
| 2024 | £717.3 million | n/a | Not mentioned |
 TCAP
TCAP
TP ICAP Group PLC
BBY
Balfour Beatty plc
 INCH
INCH
Inchcape PLC
 HEMO
HEMO
Hemogenyx Pharmaceuticals PLC
GSK
GSK plc
PGH
Personal Group Holdings PLC
GBG
GB Group plc
 WOSG
WOSG
Watches Of Switzerland Group PLC
BATS
British American Tobacco PLC
 FGEN
FGEN
Foresight Environmental Infrastructure Limited
 TET
TET
Treatt PLC
TRN
Trainline Plc
 ACSO
ACSO
Accesso Technology Group PLC
 RCP
RCP
RIT Capital Partners
PRU
Prudential plc
 NXT
NXT
Next PLC
| Financial Year | Full Price Sales | Total Group Sales | NEXT Group Profit Before Tax | Pre-tax EPS | Post-tax EPS |
|---|---|---|---|---|---|
| 2025/26 (New Guidance) | £5.4bn (+6.0%) | £6.6bn (+5.0%) | £1,080m (+6.8%) | 929.6p (+10.0%) | 698.1p (+9.7%) |
| 2025/26 (Previous Guidance) | £5.3bn (+5.0%) | £6.6bn (+4.4%) | £1,066m (+5.4%) | 919.6p (+8.8%) | 690.7p (+8.5%) |
| 2024/25 | N/A | N/A | N/A | N/A | N/A |
| 2023/24 | N/A | N/A | N/A | N/A | N/A |
 BIRG
BIRG
Bank of Ireland Group PLC
 MOTR
MOTR
Motorpoint Group PLC
CNA
Centrica PLC
 JET2
JET2
Jet2 PLC
 BTRW
BTRW
Barratt Redrow plc
TSCO
Tesco PLC
MONY
MONY Group plc
RKT
Reckitt Benckiser Group PLC
DWL
Dowlais Group Plc
 POLN
POLN
Pollen Street PLC
 N91
N91
Ninety One PLC
IWG
IWG PLC
 GLEN
GLEN
Glencore PLC
UPR
Uniphar Group PLC
 VTY
VTY
Vistry Group PLC
 KYGA
KYGA
Kerry Group
 KIE
KIE
Kier Group PLC
CCR
C&C Group plc
CHRY
Chrysalis Investments Ltd
| 31-Mar-2025 | 31-Dec-2024 | |
|---|---|---|
| Net Asset Value per share | 152.62 pence | 156.62 pence |
| Change in NAV per share | -4.0 pence (-2.6%) | N/A |
| Gross cash and equivalents | £114 million | N/A |
| Position in Wise | £3 million | N/A |
| Total liquidity position | £117 million | N/A |
| Gross debt | N/A | N/A |
| Net debt | N/A | N/A |
 RSW
RSW
Renishaw PLC
| Financial Year | Revenue (£) | Adjusted Profit Before Tax (£) | Statutory Profit Before Tax (£) | Cash, Cash Equivalents and Bank Deposits (£) |
|---|---|---|---|---|
| Q3 FY2025 (3 months ended 31 March 2025) | 180.7m | 30.0m | 28.1m | 259.8m (as of 31 March 2025) |
| Q2 FY2025 (3 months ended 31 December 2024) | 167.5m | 23.5m | 23.5m | N/A |
| Q1 FY2025 (3 months ended 30 September 2024) | 173.9m | 34.0m | 34.0m | N/A |
| 9 months ended 31 March 2025 | 522.1m | 87.5m | 85.6m | N/A |
| 9 months ended 31 March 2024 | 502.9m | 86.8m | 86.8m | 217.8m (as of 30 June 2024) |
 WTB
WTB
Whitbread PLC
 LSEG
LSEG
London Stock Exchange Group PLC
 GLV
GLV
Glenveagh Properties PLC
 IGG
IGG
IG Group Holdings PLC
 PIN
PIN
Pantheon International PLC
GFTU
Grafton Group plc
 WIL
WIL
Wilmington PLC
 HMSO
HMSO
Hammerson PLC
 FUTR
FUTR
Future PLC
 STEM
STEM
SThree plc
 DORE
DORE
Downing Renewables & Infrastructure Trust PLC
 ORIT
ORIT
Octopus Renewables Infra Trust
 CHP
CHP
Caledonian Holdings PLC
 APTD
APTD
Aptitude Software Group PLC
 CAM
CAM
Camellia Plc
 THRL
THRL
Target Healthcare REIT Ltd
IRSH
IRSH
 SAG
SAG
Science Group plc
 SBRY
SBRY
J Sainsbury PLC
 KNOS
KNOS
Kainos Group PLC
 SEQI
SEQI
Sequoia Econ Infrastructure
 ULTP
ULTP
Ultimate Products Plc
 UKW
UKW
Greencoat UK Wind PLC
 INF
INF
Informa PLC
TRIG
Renewables Infrastructure Grp
 HICL
HICL
HICL Infrastructure Company Ltd
 INPP
INPP
International Public Partnership
 RR.
RR.
RR.
 GEO
GEO
Geo Exploration Limited
SYNC
Syncona Limited
 KLR
KLR
Keller Group PLC
 CLDN
CLDN
Caledonia Investments
 DLN
DLN
Derwent London PLC
MGAM
Morgan Advanced Materials plc
BBH
Bellevue Healthcare Trust PLC
 FEVR
FEVR
Fevertree Drinks Plc
STJ
St. Jamess Place plc
 QQ.
QQ.
QQ.
 MRO
MRO
Melrose Industries PLC
WIX
Wickes Group PLC
 ROR
ROR
Rotork PLC
 BA.
BA.
BA.
 JSG
JSG
Johnson Service Group Plc
 MBH
MBH
Michelmersh Brick Holdings Plc
 ELCO
ELCO
Eleco PLC
 CVCE
CVCE
CVC Income & Growth Limited
 RTW
RTW
RTW Venture Fund Ltd
 ITM
ITM
ITM Power
TBCG
TBC Bank Group PLC
 EOT
EOT
European Opportunities Trust plc
 AET
AET
Afentra PLC
| Year | Revenue | Cost of Sales | Gross Profit | Profit from Operations | Finance Income | Finance Costs | Profit/(Loss) Before Tax | Income Tax | Profit/(Loss) for the Year | Total Assets | Total Liabilities | Total Equity | Total Debt |
|---|---|---|---|---|---|---|---|---|---|---|---|---|---|
| 2024 | $180,860 | $94,124 | $86,736 | $74,469 | $106 | $9,000 | $65,575 | $13,225 | $52,350 | $226,608 | $127,979 | $98,629 | $41,416 |
| 2023 | $26,390 | $12,571 | $13,819 | $2,362 | $240 | $3,508 | $(906) | $1,799 | $(2,705) | $140,747 | $92,775 | $47,972 | $31,703 |
 ECEL
ECEL
Eurocell PLC
RAT
Rathbone Brothers PLC
 VANL
VANL
Van Elle Holdings PLC
SE77
SE77
 IPC
IPC
International Paper Company
 VEIL
VEIL
Vietnam Enterprise Investments Limited
 VOF
VOF
VinaCapital Vietnam Opportunity Fund
SE77
SE77
IMB
Imperial Brands PLC
IHG
InterContinental Hotels Group PLC
BEZ
Beazley plc
MNDI
Mondi PLC
 MOON
MOON
Moonpig Group PLC
BRWM
Blackrock World Mining Trust Plc
THRG
Throgmorton Trust Plc
 BOY
BOY
Bodycote PLC
BRGE
BlackRock Greater Europe Investment Trust plc
IRSH
IRSH
 ICGT
ICGT
ICG Enterprise Trust PLC
| 2021 | 2022 | 2023 | 2024 | 2025 | |
|---|---|---|---|---|---|
| Revenue | 2,874 | 43,436 | 134,540 | 135,216 | 134,540 |
| Net Income | -1,261 | 17,366 | 107,510 | 116,485 | 107,510 |
| Total Assets | 1,300,619 | 1,283,223 | 1,296,382 | 1,469,549 | 1,332,392 |
| Total Liabilities | 1,300,619 | 1,283,223 | 1,296,382 | 1,469,549 | 1,332,392 |
| Total Debt | 0 | 0 | 0 | 128,000,000 | 131,931,000 |
 MTC
MTC
Mothercare PLC
 KMR
KMR
Kenmare Resources PLC
ICGC
Irish Continental Group plc
 NBPE
NBPE
NB Private Equity Partners Ltd
 FSG
FSG
Foresight Group Holdings Limited
GNC
Greencore Group
IRSH
IRSH
No news for this category in the selected date range.
No news for this category in the selected date range.
HIK
Hikma Pharmaceuticals PLC
No news for this category in the selected date range.
No news for this category in the selected date range.
No news for this category in the selected date range.
No news for this category in the selected date range.
No news for this category in the selected date range.
No news for this category in the selected date range.
No news for this category in the selected date range.
No news for this category in the selected date range.
No news for this category in the selected date range.
No news for this category in the selected date range.
No news for this category in the selected date range.
No news for this category in the selected date range.
VANL
Van Elle Holdings PLC
No news for this category in the selected date range.
BARC
Barclays PLC
MER
Mears Group plc
JDG
Judges Scientific Plc
GSK
GSK plc
MNL
Manchester and London Investment Trust plc
MPAC
MPAC Group PLC
HIK
Hikma Pharmaceuticals PLC
OAP3
Octopus Apollo VCT PLC
CSSG
Croma Security Solutions Group Plc
FCIT
F&C Investment Trust PLC
FCIT
F&C Investment Trust PLC
FCIT
F&C Investment Trust PLC
GSK
GSK plc
TRN
Trainline Plc
SWR
Smurfit Westrock Plc
HSW
Hostelworld Group PLC
FDM
FDM Group Holdings PLC
GOT
Global Opportunities Trust Ord
BNZL
Bunzl PLC
RAT
Rathbone Brothers PLC
RAT
Rathbone Brothers PLC
LSL
LSL Property Services Plc
BOOM
Audioboom Group plc
LAND
Land Securities Group PLC
NG.
NG.
BATS
British American Tobacco PLC
BATS
British American Tobacco PLC
TGA
Thungela Resources Limited
RAT
Rathbone Brothers PLC
BATS
British American Tobacco PLC
RWS
RWS Holdings PLC
SPX
Spirax Group plc
87FZ
AECI Ltd
QLT
Quilter PLC
BBB
Bigblu Broadband PLC
PRU
Prudential plc
LUCE
Luceco plc
PRU
Prudential plc
DNLM
Dunelm Group PLC
CTA
CT Automotive Group PLC
HEMO
Hemogenyx Pharmaceuticals PLC
No news for this category in the selected date range.
No news for this category in the selected date range.
No news for this category in the selected date range.
No news for this category in the selected date range.
GEO
Geo Exploration Limited
No news for this category in the selected date range.
No news for this category in the selected date range.
FLTR
Flutter Entertainment PLC
INSG
Insig Ai PLC
No news for this category in the selected date range.
No news for this category in the selected date range.
0Q0J
0Q0J
EOT
European Opportunities Trust plc
No news for this category in the selected date range.
No news for this category in the selected date range.
ANIC
Agronomics Ltd
No news for this category in the selected date range.
TXP
Touchstone Exploration Inc
FCH
Funding Circle Holdings PLC
TXP
Touchstone Exploration Inc
PULS
Pulsar Group plc
No news for this category in the selected date range.
No news for this category in the selected date range.
MAI
Maintel Holdings Plc
LTOD
Larsen & Toubro Limited
NAIT
The North American Income Trust plc
FE80
FE80
TSCO
Tesco PLC
IRSH
IRSH
3IN
3I Infrastructure PLC
AET
Afentra PLC
| Year | Revenue | Cost of Sales | Gross Profit | Profit from Operations | Finance Income | Finance Costs | Profit/(Loss) Before Tax | Income Tax | Profit/(Loss) for the Year | Total Assets | Total Liabilities | Total Equity | Total Debt |
|---|---|---|---|---|---|---|---|---|---|---|---|---|---|
| 2024 | $180,860 | $94,124 | $86,736 | $74,469 | $106 | $9,000 | $65,575 | $13,225 | $52,350 | $226,608 | $127,979 | $98,629 | $41,416 |
| 2023 | $26,390 | $12,571 | $13,819 | $2,362 | $240 | $3,508 | $(906) | $1,799 | $(2,705) | $140,747 | $92,775 | $47,972 | $31,703 |
IRSH
IRSH
IRSH
IRSH
ANTO
Antofagasta PLC
SYNC
Syncona Limited
IHG
InterContinental Hotels Group PLC
UPR
Uniphar Group PLC
GYM
The GYM Group PLC
ROSE
Rosebank Industries PLC
NLB
Nova Ljubljanska Banka d.d.
GENL
Genel Energy Plc
KNM
Konami Holdings Corp
PU26
PU26
RM.
RM.
OBI
Ondine Biomedical Inc
HGT
HG Capital Trust PLC
SREI
Schroder Real Estate Investment Trust Ltd
LIKE
Likewise Group PLC
AAF
Airtel Africa Plc
| Year | Revenue | Operating Profit | Profit/Loss After Tax | EPS (Basic) | Capex | Net Debt | Leverage |
|---|---|---|---|---|---|---|---|
| 2025 | $4,955m | $1,457m | $328m | 6.0 cents | $670m | $5,363m | 2.3x |
| 2024 | $4,979m | $1,640m | $(89)m | (4.4) cents | $737m | $3,505m | 1.4x |
FLTR
Flutter Entertainment PLC
| Financial Metrics | Q1 2025 | Q1 2024 | YoY Change | ||||
|---|---|---|---|---|---|---|---|
| Amount | % | Amount | % | % | |||
| Average Monthly Players (AMPs) | 14,880 | 13,722 | +8% | ||||
| Revenue | $3,665 million | $3,397 million | +8% | ||||
| Net Income | $335 million | $(177) million | +289% | ||||
| Net Income Margin | 9.1% | (5.2)% | +1,440 bps | ||||
| Adjusted EBITDA | $616 million | $514 million | +20% | ||||
| Adjusted EBITDA Margin | 16.8% | 15.1% | +170 bps | ||||
| Earnings per Share | $1.57 | $(1.10) | +243% | ||||
| Adjusted Earnings per Share | $1.59 | $1.05 | +51% | ||||
| Net Cash from Operating Activities | $188 million | $337 million | (44)% | ||||
| Free Cash Flow | $88 million | $185 million | (52)% | ||||
LORD
Lords Grp Trading Plc
| Year | Revenue | Adjusted EBITDA | Adjusted Operating Profit | Net Debt |
|---|---|---|---|---|
| 2024 | £436.7m | £22.4m | £10.4m | £32.4m |
| 2023 | £462.6m | £26.8m | £16.5m | £28.5m |
| Change | (5.6)% | (16.5)% | (37.0)% | +13.5% |
MXCT
MaxCyte Inc
| Financial Metric | Q1 2025 | Q1 2024 | Change |
|---|---|---|---|
| Total Revenue | $10.4 million | $11.3 million | -8% |
| Core Business Revenue | $8.2 million | $8.2 million | 1% |
| SPL Program-related Revenue | $2.1 million | $3.2 million | -32% |
| Gross Profit | $8.9 million | $9.9 million | N/A |
| Gross Margin | 86% | 88% | N/A |
| Operating Expenses | $21.2 million | $22.2 million | N/A |
| Net Loss | $10.3 million | $9.5 million | N/A |
| EBITDA | Loss of $11.2 million | Loss of $11.2 million | N/A |
| Cash, Cash Equivalents, and Investments | $174.7 million | N/A | N/A |
3IN
3I Infrastructure PLC
| Year | Total Return | Total Income | Total Liquidity | Net Debt |
|---|---|---|---|---|
| 2025 | £333m | £204m | £644m | £256m |
| 2024 | £347m | £194m | £395m | £505m |
HTWS
Helios Towers Plc
| Financial Metrics | Q1 2025 | Q1 2024 | Change | Q1 2025 | Q4 2024 | Change |
|---|---|---|---|---|---|---|
| Sites | 14,417 | 14,166 | +2% | 14,417 | 14,325 | +1% |
| Tenancies | 30,074 | 27,686 | +9% | 30,074 | 29,406 | +2% |
| Tenancy Ratio | 2.09x | 1.95x | +0.14x | 2.09x | 2.05x | +0.04x |
| Revenue (US$m) | 203.8 | 194.6 | +5% | 203.8 | 207.3 | -2% |
| Adjusted EBITDA (US$m) | 111.1 | 102.2 | +9% | 111.1 | 109.1 | +2% |
| Adjusted EBITDA Margin | 55% | 53% | +2ppt | 55% | 53% | +2ppt |
| Operating Profit (US$m) | 76.6 | 67.3 | +14% | 76.6 | 51.7 | +48% |
| ROIC | 13.8% | 12.6% | +1.2ppt | 13.8% | 12.9% | +0.9ppt |
| Free Cash Flow (US$m) | 1.5 | -27.7 | +29.2 | 1.5 | 39.8 | -38.3 |
| Net Debt (US$m) | 1,768.5 | 1,812.1 | -2% | 1,768.5 | 1,735.5 | +2% |
| Net Leverage | 4.0x | 4.4x | -0.4x | 4.0x | 4.0x | 0 |
POLX
Polarean Imaging Plc
| Financial Metrics | FY 2023 | FY 2024 | Change |
|---|---|---|---|
| Revenue | $890,933 | $3,089,957 | 246.9% |
| Cost of Sales | $555,450 | $1,666,667 | 201.0% |
| Gross Profit | $335,483 | $1,423,290 | 324.2% |
| Administrative Expenses | $3,337,836 | $3,102,331 | -7.1% |
| Research, Development & Regulatory Expenses | $4,194,006 | $3,440,590 | -17.9% |
| Depreciation | $208,786 | $254,993 | 22.1% |
| Amortization | $728,411 | $710,058 | -2.5% |
| Selling & Distribution Expenses | $3,562,412 | $1,950,755 | -45.2% |
| Share-Based Payment Expense | $860,195 | $713,895 | -17.0% |
| Total Operating Costs | $12,891,646 | $10,172,622 | -21.1% |
| Operating Loss | $12,556,163 | $8,749,332 | -30.3% |
| Finance Income | $298,899 | $274,838 | -8.0% |
| Finance Expense | $15,990 | $16,178 | 1.1% |
| Other Losses/Gains - Net | $388,451 | $(49,300) | -113.4% |
| Loss Before Tax | $11,884,803 | $8,539,972 | -28.1% |
| Taxation | $0 | $0 | 0.0% |
| Loss for the Year | $11,884,803 | $8,539,972 | -28.1% |
| Net Cash | $6,171,636 | $12,111,708 | 96.2% |
| Debt | FY 2023 | FY 2024 | Change |
|---|---|---|---|
| Lease Liability (Non-Current) | $74,846 | $374,265 | 400.5% |
| Trade & Other Payables (Non-Current) | $240,000 | $120,000 | -50.0% |
| Contract Liabilities (Non-Current) | $67,032 | $56,771 | -15.3% |
| Total Non-Current Debt | $381,878 | $551,036 | 44.2% |
| Lease Liability (Current) | $141,845 | $129,521 | -8.7% |
| Trade & Other Payables (Current) | $1,831,587 | $2,702,879 | 47.5% |
| Contract Liabilities (Current) | $228,878 | $266,265 | 16.3% |
| Total Current Debt | $2,202,310 | $3,098,665 | 40.7% |
| Total Debt | $2,584,188 | $3,650,601 | 41.2% |
TBCG
TBC Bank Group PLC
SE77
SE77
IPC
International Paper Company
ICGT
ICG Enterprise Trust PLC
| 2021 | 2022 | 2023 | 2024 | 2025 | |
|---|---|---|---|---|---|
| Revenue | 2,874 | 43,436 | 134,540 | 135,216 | 134,540 |
| Net Income | -1,261 | 17,366 | 107,510 | 116,485 | 107,510 |
| Total Assets | 1,300,619 | 1,283,223 | 1,296,382 | 1,469,549 | 1,332,392 |
| Total Liabilities | 1,300,619 | 1,283,223 | 1,296,382 | 1,469,549 | 1,332,392 |
| Total Debt | 0 | 0 | 0 | 128,000,000 | 131,931,000 |
No news for this category in the selected date range.
No news for this category in the selected date range.
No news for this category in the selected date range.
88E
88 Energy Ltd
FSFL
Foresight Solar Fund Ltd
SPT
Spirent Communications plc
CORO
Coro Energy PLC
EDV
Endeavour Mining Corp
CVSG
CVS Group Plc
ADIG
Aberdeen Diversified Income and Growth Trust PLC
0RYA
Ryanair Holdings plc
SREI
Schroder Real Estate Investment Trust Ltd
STJ
St. Jamess Place plc
SORT
Sorted Group Holdings Plc
MIRI
Mirriad Advertising PLC
GBG
GB Group plc
CCR
C&C Group plc
RWI
Renewi PLC
FEN
Frenkel Topping Group
SCP
Schroder UK Mid Cap Fund PLC
DAL
Dalata Hotel Group plc
MRL
Marlowe plc
PAF
Pan African Resources PLC
SOS
Sosandar Plc
BOWL
Hollywood Bowl Group PLC
ELIX
Elixirr International Plc
IXI
IXICO PLC
IDS
International Distributions Services PLC
SDV
Chelverton UK Dividend Trust PLC
DFCH
Distribution Finance Capital Holdings PLC
REVB
Revolution Beauty Group PLC
UPR
Uniphar Group PLC
HSW
Hostelworld Group PLC
SPEC
Inspecs Group plc
BBH
Bellevue Healthcare Trust PLC
No news for this category in the selected date range.
No news for this category in the selected date range.
CNA
Centrica PLC
NWOR
National World PLC
ZOO
Zoo Digital Group Plc
| Year | Revenue | EBITDA | Net Cash | Cost Savings |
|---|---|---|---|---|
| FY25 | $49.4 million | At least $0.1 million | $2.6 million | $6.8 million |
| FY24 | N/A | Loss of $13.6 million | N/A | N/A |
MGAM
Morgan Advanced Materials plc
GENL
Genel Energy Plc
MTRO
Metro Bank PLC
CRN
Cairn Homes PLC
| Year | Revenue Growth | Operating Profit | ROE | Debt |
|---|---|---|---|---|
| 2025 | In excess of 10% | €160 million | c.15.5% | Not mentioned |
| 2024 | Not mentioned | Not mentioned | Not mentioned | Not mentioned |
BIG
Big Technologies PLC
BSRT
Baker Steel Resources Trust
0A28
Prosus N.V.
HBR
Harbour Energy PLC
KMK
Kromek Group PLC
| Full Year 2025 | Full Year 2024 | |
|---|---|---|
| Revenue | Not less than £26 million | N/A |
| Year-on-Year Revenue Growth | At least 34% growth | N/A |
| Profit Before Tax | Slightly ahead of market expectations | N/A |
| Group Debt | £0.5 million | £12.3 million |
MIRI
Mirriad Advertising PLC
IMI
IMI PLC
| Financial Metric | 2025 | 2024 | Change |
|---|---|---|---|
| Group Organic Revenue | 3% lower | N/A | N/A |
| Adjusted Revenue | 5% lower | N/A | N/A |
| Group Margins | Improved | N/A | N/A |
| Automation Revenue | 4% lower | N/A | N/A |
| Process Automation Revenue | 1% lower | 27% growth | Negative Change |
| Process Automation Orders | 7% increase | N/A | N/A |
| Aftermarket Orders | 19% increase | N/A | N/A |
| Industrial Automation Revenue | 7% lower | N/A | N/A |
| Life Technology Revenue | 2% lower | N/A | N/A |
| Climate Control Revenue | 4% higher | N/A | N/A |
| Life Science and Fluid Control Revenue | Flat | N/A | N/A |
| Transport Revenue | 16% lower | 19% growth | Negative Change |
| Adjusted Basic Earnings per Share CAGR | 11% | N/A | N/A |
| Amount Returned to Shareholders | £650m | N/A | N/A |
| Share Buyback | £200m | N/A | N/A |
| Impact of Exchange Rates on Revenue and Adjusted Operating Profit | 2% negative impact | N/A | N/A |
| Full Year Adjusted EPS Guidance | 129p-136p | N/A | N/A |
| Weighted Average Number of Shares | Around 249 million | N/A | N/A |
SFOR
S4 Capital PLC
| Financial Metrics | Q1 2025 | Change Reported | Change Like-for-Like | Change Pro-forma | Q1 2024 |
|---|---|---|---|---|---|
| Billings | £463.3 million | 7.7% | 8.6% | 8.6% | £430.1 million |
| Revenue | £178.1 million | -15.3% | -14.3% | -14.3% | £210.2 million |
| Net Revenue | £163.7 million | -12.2% | -11.4% | -11.4% | £186.4 million |
| Net Debt | £144.8 million | N/A | N/A | N/A | £206.0 million |
| Net Revenue by Segment | Q1 2025 | Change Reported | Change Like-for-Like | Q1 2024 |
|---|---|---|---|---|
| Marketing Services | £148.3 million | -8.6% | -7.5% | £162.2 million |
| Technology Services | £15.4 million | -36.4% | -36.9% | £24.2 million |
| Net Revenue by Geography | Q1 2025 | Change Reported | Change Like-for-Like | Q1 2024 |
|---|---|---|---|---|
| Americas | £130.5 million | -11.0% | -10.5% | £146.7 million |
| EMEA | £24.3 million | -17.3% | -15.9% | £29.4 million |
| Asia-Pacific | £8.9 million | -13.6% | -11.0% | £10.3 million |
FRP
Frp Advisory Group Plc
CHRY
Chrysalis Investments Ltd
IHG
InterContinental Hotels Group PLC
SBDS
Silver Bullet Data Services Group PLC
TUN
Tungsten West PLC
GFTU
Grafton Group plc
| Financial Year | Revenue (£ million) | Average Daily Like-for-Like Revenue Change | Debt |
|---|---|---|---|
| 2025 | £773.1 million | 2.7% increase | Not mentioned |
| 2024 | £717.3 million | n/a | Not mentioned |
BBY
Balfour Beatty plc
PGH
Personal Group Holdings PLC
NXT
Next PLC
| Financial Year | Full Price Sales | Total Group Sales | NEXT Group Profit Before Tax | Pre-tax EPS | Post-tax EPS |
|---|---|---|---|---|---|
| 2025/26 (New Guidance) | £5.4bn (+6.0%) | £6.6bn (+5.0%) | £1,080m (+6.8%) | 929.6p (+10.0%) | 698.1p (+9.7%) |
| 2025/26 (Previous Guidance) | £5.3bn (+5.0%) | £6.6bn (+4.4%) | £1,066m (+5.4%) | 919.6p (+8.8%) | 690.7p (+8.5%) |
| 2024/25 | N/A | N/A | N/A | N/A | N/A |
| 2023/24 | N/A | N/A | N/A | N/A | N/A |
MONY
MONY Group plc
DWL
Dowlais Group Plc
CHRY
Chrysalis Investments Ltd
| 31-Mar-2025 | 31-Dec-2024 | |
|---|---|---|
| Net Asset Value per share | 152.62 pence | 156.62 pence |
| Change in NAV per share | -4.0 pence (-2.6%) | N/A |
| Gross cash and equivalents | £114 million | N/A |
| Position in Wise | £3 million | N/A |
| Total liquidity position | £117 million | N/A |
| Gross debt | N/A | N/A |
| Net debt | N/A | N/A |
RSW
Renishaw PLC
| Financial Year | Revenue (£) | Adjusted Profit Before Tax (£) | Statutory Profit Before Tax (£) | Cash, Cash Equivalents and Bank Deposits (£) |
|---|---|---|---|---|
| Q3 FY2025 (3 months ended 31 March 2025) | 180.7m | 30.0m | 28.1m | 259.8m (as of 31 March 2025) |
| Q2 FY2025 (3 months ended 31 December 2024) | 167.5m | 23.5m | 23.5m | N/A |
| Q1 FY2025 (3 months ended 30 September 2024) | 173.9m | 34.0m | 34.0m | N/A |
| 9 months ended 31 March 2025 | 522.1m | 87.5m | 85.6m | N/A |
| 9 months ended 31 March 2024 | 502.9m | 86.8m | 86.8m | 217.8m (as of 30 June 2024) |
CHP
Caledonian Holdings PLC
THRL
Target Healthcare REIT Ltd
IRSH
IRSH
DLN
Derwent London PLC
RAT
Rathbone Brothers PLC
MNDI
Mondi PLC
MTC
Mothercare PLC
ICGC
Irish Continental Group plc
No news for this category in the selected date range.
No news for this category in the selected date range.
No news for this category in the selected date range.
Tap any ticker row to open its mobile stock terminal. Today’s move updates from the same stock-terminal feed.
| Year | Revenue | EBITDA | Net Cash | Cost Savings |
|---|---|---|---|---|
| FY25 | $49.4 million | At least $0.1 million | $2.6 million | $6.8 million |
| FY24 | N/A | Loss of $13.6 million | N/A | N/A |
| Year | Revenue Growth | Operating Profit | ROE | Debt |
|---|---|---|---|---|
| 2025 | In excess of 10% | €160 million | c.15.5% | Not mentioned |
| 2024 | Not mentioned | Not mentioned | Not mentioned | Not mentioned |
| Year | Revenue | Operating Profit | Profit/Loss After Tax | EPS (Basic) | Capex | Net Debt | Leverage |
|---|---|---|---|---|---|---|---|
| 2025 | $4,955m | $1,457m | $328m | 6.0 cents | $670m | $5,363m | 2.3x |
| 2024 | $4,979m | $1,640m | $(89)m | (4.4) cents | $737m | $3,505m | 1.4x |
| Financial Metrics | Q1 2025 | Q1 2024 | YoY Change | ||||
|---|---|---|---|---|---|---|---|
| Amount | % | Amount | % | % | |||
| Average Monthly Players (AMPs) | 14,880 | 13,722 | +8% | ||||
| Revenue | $3,665 million | $3,397 million | +8% | ||||
| Net Income | $335 million | $(177) million | +289% | ||||
| Net Income Margin | 9.1% | (5.2)% | +1,440 bps | ||||
| Adjusted EBITDA | $616 million | $514 million | +20% | ||||
| Adjusted EBITDA Margin | 16.8% | 15.1% | +170 bps | ||||
| Earnings per Share | $1.57 | $(1.10) | +243% | ||||
| Adjusted Earnings per Share | $1.59 | $1.05 | +51% | ||||
| Net Cash from Operating Activities | $188 million | $337 million | (44)% | ||||
| Free Cash Flow | $88 million | $185 million | (52)% | ||||
| Full Year 2025 | Full Year 2024 | |
|---|---|---|
| Revenue | Not less than £26 million | N/A |
| Year-on-Year Revenue Growth | At least 34% growth | N/A |
| Profit Before Tax | Slightly ahead of market expectations | N/A |
| Group Debt | £0.5 million | £12.3 million |
| Year | Revenue | Adjusted EBITDA | Adjusted Operating Profit | Net Debt |
|---|---|---|---|---|
| 2024 | £436.7m | £22.4m | £10.4m | £32.4m |
| 2023 | £462.6m | £26.8m | £16.5m | £28.5m |
| Change | (5.6)% | (16.5)% | (37.0)% | +13.5% |
| Financial Metric | Q1 2025 | Q1 2024 | Change |
|---|---|---|---|
| Total Revenue | $10.4 million | $11.3 million | -8% |
| Core Business Revenue | $8.2 million | $8.2 million | 1% |
| SPL Program-related Revenue | $2.1 million | $3.2 million | -32% |
| Gross Profit | $8.9 million | $9.9 million | N/A |
| Gross Margin | 86% | 88% | N/A |
| Operating Expenses | $21.2 million | $22.2 million | N/A |
| Net Loss | $10.3 million | $9.5 million | N/A |
| EBITDA | Loss of $11.2 million | Loss of $11.2 million | N/A |
| Cash, Cash Equivalents, and Investments | $174.7 million | N/A | N/A |
| Year | Total Return | Total Income | Total Liquidity | Net Debt |
|---|---|---|---|---|
| 2025 | £333m | £204m | £644m | £256m |
| 2024 | £347m | £194m | £395m | £505m |
| Financial Metrics | Q1 2025 | Q1 2024 | Change | Q1 2025 | Q4 2024 | Change |
|---|---|---|---|---|---|---|
| Sites | 14,417 | 14,166 | +2% | 14,417 | 14,325 | +1% |
| Tenancies | 30,074 | 27,686 | +9% | 30,074 | 29,406 | +2% |
| Tenancy Ratio | 2.09x | 1.95x | +0.14x | 2.09x | 2.05x | +0.04x |
| Revenue (US$m) | 203.8 | 194.6 | +5% | 203.8 | 207.3 | -2% |
| Adjusted EBITDA (US$m) | 111.1 | 102.2 | +9% | 111.1 | 109.1 | +2% |
| Adjusted EBITDA Margin | 55% | 53% | +2ppt | 55% | 53% | +2ppt |
| Operating Profit (US$m) | 76.6 | 67.3 | +14% | 76.6 | 51.7 | +48% |
| ROIC | 13.8% | 12.6% | +1.2ppt | 13.8% | 12.9% | +0.9ppt |
| Free Cash Flow (US$m) | 1.5 | -27.7 | +29.2 | 1.5 | 39.8 | -38.3 |
| Net Debt (US$m) | 1,768.5 | 1,812.1 | -2% | 1,768.5 | 1,735.5 | +2% |
| Net Leverage | 4.0x | 4.4x | -0.4x | 4.0x | 4.0x | 0 |
| Financial Metrics | FY 2023 | FY 2024 | Change |
|---|---|---|---|
| Revenue | $890,933 | $3,089,957 | 246.9% |
| Cost of Sales | $555,450 | $1,666,667 | 201.0% |
| Gross Profit | $335,483 | $1,423,290 | 324.2% |
| Administrative Expenses | $3,337,836 | $3,102,331 | -7.1% |
| Research, Development & Regulatory Expenses | $4,194,006 | $3,440,590 | -17.9% |
| Depreciation | $208,786 | $254,993 | 22.1% |
| Amortization | $728,411 | $710,058 | -2.5% |
| Selling & Distribution Expenses | $3,562,412 | $1,950,755 | -45.2% |
| Share-Based Payment Expense | $860,195 | $713,895 | -17.0% |
| Total Operating Costs | $12,891,646 | $10,172,622 | -21.1% |
| Operating Loss | $12,556,163 | $8,749,332 | -30.3% |
| Finance Income | $298,899 | $274,838 | -8.0% |
| Finance Expense | $15,990 | $16,178 | 1.1% |
| Other Losses/Gains - Net | $388,451 | $(49,300) | -113.4% |
| Loss Before Tax | $11,884,803 | $8,539,972 | -28.1% |
| Taxation | $0 | $0 | 0.0% |
| Loss for the Year | $11,884,803 | $8,539,972 | -28.1% |
| Net Cash | $6,171,636 | $12,111,708 | 96.2% |
| Debt | FY 2023 | FY 2024 | Change |
|---|---|---|---|
| Lease Liability (Non-Current) | $74,846 | $374,265 | 400.5% |
| Trade & Other Payables (Non-Current) | $240,000 | $120,000 | -50.0% |
| Contract Liabilities (Non-Current) | $67,032 | $56,771 | -15.3% |
| Total Non-Current Debt | $381,878 | $551,036 | 44.2% |
| Lease Liability (Current) | $141,845 | $129,521 | -8.7% |
| Trade & Other Payables (Current) | $1,831,587 | $2,702,879 | 47.5% |
| Contract Liabilities (Current) | $228,878 | $266,265 | 16.3% |
| Total Current Debt | $2,202,310 | $3,098,665 | 40.7% |
| Total Debt | $2,584,188 | $3,650,601 | 41.2% |
| Financial Year | Revenue (£ million) | Average Daily Like-for-Like Revenue Change | Debt |
|---|---|---|---|
| 2025 | £773.1 million | 2.7% increase | Not mentioned |
| 2024 | £717.3 million | n/a | Not mentioned |
| Financial Year | Full Price Sales | Total Group Sales | NEXT Group Profit Before Tax | Pre-tax EPS | Post-tax EPS |
|---|---|---|---|---|---|
| 2025/26 (New Guidance) | £5.4bn (+6.0%) | £6.6bn (+5.0%) | £1,080m (+6.8%) | 929.6p (+10.0%) | 698.1p (+9.7%) |
| 2025/26 (Previous Guidance) | £5.3bn (+5.0%) | £6.6bn (+4.4%) | £1,066m (+5.4%) | 919.6p (+8.8%) | 690.7p (+8.5%) |
| 2024/25 | N/A | N/A | N/A | N/A | N/A |
| 2023/24 | N/A | N/A | N/A | N/A | N/A |
| 31-Mar-2025 | 31-Dec-2024 | |
|---|---|---|
| Net Asset Value per share | 152.62 pence | 156.62 pence |
| Change in NAV per share | -4.0 pence (-2.6%) | N/A |
| Gross cash and equivalents | £114 million | N/A |
| Position in Wise | £3 million | N/A |
| Total liquidity position | £117 million | N/A |
| Gross debt | N/A | N/A |
| Net debt | N/A | N/A |
| Financial Year | Revenue (£) | Adjusted Profit Before Tax (£) | Statutory Profit Before Tax (£) | Cash, Cash Equivalents and Bank Deposits (£) |
|---|---|---|---|---|
| Q3 FY2025 (3 months ended 31 March 2025) | 180.7m | 30.0m | 28.1m | 259.8m (as of 31 March 2025) |
| Q2 FY2025 (3 months ended 31 December 2024) | 167.5m | 23.5m | 23.5m | N/A |
| Q1 FY2025 (3 months ended 30 September 2024) | 173.9m | 34.0m | 34.0m | N/A |
| 9 months ended 31 March 2025 | 522.1m | 87.5m | 85.6m | N/A |
| 9 months ended 31 March 2024 | 502.9m | 86.8m | 86.8m | 217.8m (as of 30 June 2024) |
| 2021 | 2022 | 2023 | 2024 | 2025 | |
|---|---|---|---|---|---|
| Revenue | 2,874 | 43,436 | 134,540 | 135,216 | 134,540 |
| Net Income | -1,261 | 17,366 | 107,510 | 116,485 | 107,510 |
| Total Assets | 1,300,619 | 1,283,223 | 1,296,382 | 1,469,549 | 1,332,392 |
| Total Liabilities | 1,300,619 | 1,283,223 | 1,296,382 | 1,469,549 | 1,332,392 |
| Total Debt | 0 | 0 | 0 | 128,000,000 | 131,931,000 |
TR1 Buy
<mark style="background-color:yellow">TR1</mark> Buy
TR1 Buy
<mark style="background-color:yellow">Purchase</mark> of Shares
Mpac Group plc, the global packaging and automation solutions Group, announces that it has been informed that today William Wilkins, Group Finance Director, sold 45,000 Ordinary Shares at a price of 372 pence per Ordinary Share in order to…
TR1 Buy
TR1 Buy
TR1 Buy
<mark style="background-color:yellow">Purchase</mark> of shares
TR1 Buy
TR1 Buy
TR1 Buy
<mark style="background-color:yellow">Purchase</mark> of ordinary shares under the Partnership Share Scheme - a HMRC approved Share Incentive Plan
The London Stock Exchange plc does not endorse or verify the content on this website, and users are solely responsible for verifying the information. Any news item, including prospectuses, should be relied upon only by the intended recipie…
<mark style="background-color:yellow">Purchase</mark> of shares
TR1 Buy
iii) <mark style="background-color:yellow">Purchase</mark> of Prudential plc shares
TR1 Buy
TR1 Buy
Hikma Pharmaceuticals PLC has reached a preliminary settlement agreement to resolve the majority of class action antitrust lawsuits in the US regarding its drug Xyrem® (sodium oxybate). The company will pay up to $50 million in cash, pendi…
Here is a summary of the trading update from Zoo Digital Group PLC: - Zoo Digital Group PLC has released its trading update for the financial year ended March 31, 2025. The company expects a 22% increase in revenue to $49.4 million and an…
| Year | Revenue | EBITDA | Net Cash | Cost Savings |
|---|---|---|---|---|
| FY25 | $49.4 million | At least $0.1 million | $2.6 million | $6.8 million |
| FY24 | N/A | Loss of $13.6 million | N/A | N/A |
Here is a summary of the trading update from Cairn Homes Plcs 2025 Annual General Meeting (AGM): - Cairn Homes Plc is providing an update on its current trading performance for the fiscal year 2025 (FY25) ahead of its AGM. - The company h…
| Year | Revenue Growth | Operating Profit | ROE | Debt |
|---|---|---|---|---|
| 2025 | In excess of 10% | €160 million | c.15.5% | Not mentioned |
| 2024 | Not mentioned | Not mentioned | Not mentioned | Not mentioned |
Insig AI Plc, a data science and machine learning solutions company, has secured a new client, a London-based asset manager with over £25 billion in assets under management. The client has signed a commercial agreement with Insig AI that i…
Agronomics Limited, a leading listed company in the field of clean food, announces a manufacturing partnership between its portfolio company, Liberation Labs, and Dutch ingredients startup Vivici. Liberation Labs will produce ViviteinTM BL…
TR1 Buy
Airtel Africa released its financial results for the year ended March 31, 2025, reporting a 21.1% increase in revenue in constant currency and a 0.5% decline in reported currency. The companys total customer base grew by 8.7% to 166.1 mill…
| Year | Revenue | Operating Profit | Profit/Loss After Tax | EPS (Basic) | Capex | Net Debt | Leverage |
|---|---|---|---|---|---|---|---|
| 2025 | $4,955m | $1,457m | $328m | 6.0 cents | $670m | $5,363m | 2.3x |
| 2024 | $4,979m | $1,640m | $(89)m | (4.4) cents | $737m | $3,505m | 1.4x |
Flutter Entertainment, a leading global online sports betting and iGaming operator, has reported strong financial results for the first quarter of 2025. The companys revenue increased by 8% year-over-year to $3.66 billion, driven by an 8% …
| Financial Metrics | Q1 2025 | Q1 2024 | YoY Change | ||||
|---|---|---|---|---|---|---|---|
| Amount | % | Amount | % | % | |||
| Average Monthly Players (AMPs) | 14,880 | 13,722 | +8% | ||||
| Revenue | $3,665 million | $3,397 million | +8% | ||||
| Net Income | $335 million | $(177) million | +289% | ||||
| Net Income Margin | 9.1% | (5.2)% | +1,440 bps | ||||
| Adjusted EBITDA | $616 million | $514 million | +20% | ||||
| Adjusted EBITDA Margin | 16.8% | 15.1% | +170 bps | ||||
| Earnings per Share | $1.57 | $(1.10) | +243% | ||||
| Adjusted Earnings per Share | $1.59 | $1.05 | +51% | ||||
| Net Cash from Operating Activities | $188 million | $337 million | (44)% | ||||
| Free Cash Flow | $88 million | $185 million | (52)% | ||||
Kromek Group plc, a developer of radiation and bio-detection technology, released a positive trading update for the full year 2025. The company expects to report revenue of at least £26 million, representing year-over-year growth of 34% or…
| Full Year 2025 | Full Year 2024 | |
|---|---|---|
| Revenue | Not less than £26 million | N/A |
| Year-on-Year Revenue Growth | At least 34% growth | N/A |
| Profit Before Tax | Slightly ahead of market expectations | N/A |
| Group Debt | £0.5 million | £12.3 million |
Here is a summary of the trading update from IMI PLC for the first quarter of 2025: - IMI PLC, a specialist engineering company, reconfirms its full-year guidance, expecting mid-single-digit organic revenue growth in 2025. - The company e…
| Financial Metric | 2025 | 2024 | Change |
|---|---|---|---|
| Group Organic Revenue | 3% lower | N/A | N/A |
| Adjusted Revenue | 5% lower | N/A | N/A |
| Group Margins | Improved | N/A | N/A |
| Automation Revenue | 4% lower | N/A | N/A |
| Process Automation Revenue | 1% lower | 27% growth | Negative Change |
| Process Automation Orders | 7% increase | N/A | N/A |
| Aftermarket Orders | 19% increase | N/A | N/A |
| Industrial Automation Revenue | 7% lower | N/A | N/A |
| Life Technology Revenue | 2% lower | N/A | N/A |
| Climate Control Revenue | 4% higher | N/A | N/A |
| Life Science and Fluid Control Revenue | Flat | N/A | N/A |
| Transport Revenue | 16% lower | 19% growth | Negative Change |
| Adjusted Basic Earnings per Share CAGR | 11% | N/A | N/A |
| Amount Returned to Shareholders | £650m | N/A | N/A |
| Share Buyback | £200m | N/A | N/A |
| Impact of Exchange Rates on Revenue and Adjusted Operating Profit | 2% negative impact | N/A | N/A |
| Full Year Adjusted EPS Guidance | 129p-136p | N/A | N/A |
| Weighted Average Number of Shares | Around 249 million | N/A | N/A |
Here is a summary of the key points from the trading statement of S4 Capital PLC for the first quarter of 2025: - S4 Capital PLCs first-quarter performance was impacted by volatile global macroeconomic conditions, resulting in cautious cl…
| Financial Metrics | Q1 2025 | Change Reported | Change Like-for-Like | Change Pro-forma | Q1 2024 |
|---|---|---|---|---|---|
| Billings | £463.3 million | 7.7% | 8.6% | 8.6% | £430.1 million |
| Revenue | £178.1 million | -15.3% | -14.3% | -14.3% | £210.2 million |
| Net Revenue | £163.7 million | -12.2% | -11.4% | -11.4% | £186.4 million |
| Net Debt | £144.8 million | N/A | N/A | N/A | £206.0 million |
| Net Revenue by Segment | Q1 2025 | Change Reported | Change Like-for-Like | Q1 2024 |
|---|---|---|---|---|
| Marketing Services | £148.3 million | -8.6% | -7.5% | £162.2 million |
| Technology Services | £15.4 million | -36.4% | -36.9% | £24.2 million |
| Net Revenue by Geography | Q1 2025 | Change Reported | Change Like-for-Like | Q1 2024 |
|---|---|---|---|---|
| Americas | £130.5 million | -11.0% | -10.5% | £146.7 million |
| EMEA | £24.3 million | -17.3% | -15.9% | £29.4 million |
| Asia-Pacific | £8.9 million | -13.6% | -11.0% | £10.3 million |
<mark style="background-color:yellow"></mark>
Silver Bullet Data Services Group plc, a provider of AI-driven digital transformation services, released a positive trading statement for the first quarter of 2025. The company reported a 15% revenue increase compared to the same period la…
Lords Group Trading PLC, a leading distributor of building materials in the UK, released its final results for the year ended December 31, 2024. The company reported a challenging market backdrop with high-interest rates and economic headw…
| Year | Revenue | Adjusted EBITDA | Adjusted Operating Profit | Net Debt |
|---|---|---|---|---|
| 2024 | £436.7m | £22.4m | £10.4m | £32.4m |
| 2023 | £462.6m | £26.8m | £16.5m | £28.5m |
| Change | (5.6)% | (16.5)% | (37.0)% | +13.5% |
MaxCyte Inc. has released its financial results for the first quarter of 2025, with a focus on its core business revenue, strategic platform licensing, and overall financial performance. The company reported a 1% increase in core business …
| Financial Metric | Q1 2025 | Q1 2024 | Change |
|---|---|---|---|
| Total Revenue | $10.4 million | $11.3 million | -8% |
| Core Business Revenue | $8.2 million | $8.2 million | 1% |
| SPL Program-related Revenue | $2.1 million | $3.2 million | -32% |
| Gross Profit | $8.9 million | $9.9 million | N/A |
| Gross Margin | 86% | 88% | N/A |
| Operating Expenses | $21.2 million | $22.2 million | N/A |
| Net Loss | $10.3 million | $9.5 million | N/A |
| EBITDA | Loss of $11.2 million | Loss of $11.2 million | N/A |
| Cash, Cash Equivalents, and Investments | $174.7 million | N/A | N/A |
3i Infrastructure plc, a Jersey-incorporated, closed-ended investment company, announced its results for the year ended March 31, 2025. The company reported a 10.1% return for the year, achieving its FY25 dividend target of 12.65 pence per…
| Year | Total Return | Total Income | Total Liquidity | Net Debt |
|---|---|---|---|---|
| 2025 | £333m | £204m | £644m | £256m |
| 2024 | £347m | £194m | £395m | £505m |
Helios Towers, a leading independent telecommunications infrastructure company, released its unaudited financial results for the first quarter of 2025. The company reported strong operational and financial performance, with a 9% year-on-ye…
| Financial Metrics | Q1 2025 | Q1 2024 | Change | Q1 2025 | Q4 2024 | Change |
|---|---|---|---|---|---|---|
| Sites | 14,417 | 14,166 | +2% | 14,417 | 14,325 | +1% |
| Tenancies | 30,074 | 27,686 | +9% | 30,074 | 29,406 | +2% |
| Tenancy Ratio | 2.09x | 1.95x | +0.14x | 2.09x | 2.05x | +0.04x |
| Revenue (US$m) | 203.8 | 194.6 | +5% | 203.8 | 207.3 | -2% |
| Adjusted EBITDA (US$m) | 111.1 | 102.2 | +9% | 111.1 | 109.1 | +2% |
| Adjusted EBITDA Margin | 55% | 53% | +2ppt | 55% | 53% | +2ppt |
| Operating Profit (US$m) | 76.6 | 67.3 | +14% | 76.6 | 51.7 | +48% |
| ROIC | 13.8% | 12.6% | +1.2ppt | 13.8% | 12.9% | +0.9ppt |
| Free Cash Flow (US$m) | 1.5 | -27.7 | +29.2 | 1.5 | 39.8 | -38.3 |
| Net Debt (US$m) | 1,768.5 | 1,812.1 | -2% | 1,768.5 | 1,735.5 | +2% |
| Net Leverage | 4.0x | 4.4x | -0.4x | 4.0x | 4.0x | 0 |
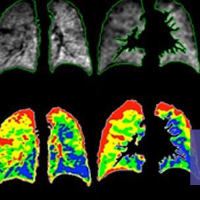
Polarean Imaging Plc, a medical device company specializing in Magnetic Resonance Imaging (MRI) of lung function, announces its final results for 2024. The company reports revenue of US$3.1 million, exceeding previous guidance. Sales of th…
| Financial Metrics | FY 2023 | FY 2024 | Change |
|---|---|---|---|
| Revenue | $890,933 | $3,089,957 | 246.9% |
| Cost of Sales | $555,450 | $1,666,667 | 201.0% |
| Gross Profit | $335,483 | $1,423,290 | 324.2% |
| Administrative Expenses | $3,337,836 | $3,102,331 | -7.1% |
| Research, Development & Regulatory Expenses | $4,194,006 | $3,440,590 | -17.9% |
| Depreciation | $208,786 | $254,993 | 22.1% |
| Amortization | $728,411 | $710,058 | -2.5% |
| Selling & Distribution Expenses | $3,562,412 | $1,950,755 | -45.2% |
| Share-Based Payment Expense | $860,195 | $713,895 | -17.0% |
| Total Operating Costs | $12,891,646 | $10,172,622 | -21.1% |
| Operating Loss | $12,556,163 | $8,749,332 | -30.3% |
| Finance Income | $298,899 | $274,838 | -8.0% |
| Finance Expense | $15,990 | $16,178 | 1.1% |
| Other Losses/Gains - Net | $388,451 | $(49,300) | -113.4% |
| Loss Before Tax | $11,884,803 | $8,539,972 | -28.1% |
| Taxation | $0 | $0 | 0.0% |
| Loss for the Year | $11,884,803 | $8,539,972 | -28.1% |
| Net Cash | $6,171,636 | $12,111,708 | 96.2% |
| Debt | FY 2023 | FY 2024 | Change |
|---|---|---|---|
| Lease Liability (Non-Current) | $74,846 | $374,265 | 400.5% |
| Trade & Other Payables (Non-Current) | $240,000 | $120,000 | -50.0% |
| Contract Liabilities (Non-Current) | $67,032 | $56,771 | -15.3% |
| Total Non-Current Debt | $381,878 | $551,036 | 44.2% |
| Lease Liability (Current) | $141,845 | $129,521 | -8.7% |
| Trade & Other Payables (Current) | $1,831,587 | $2,702,879 | 47.5% |
| Contract Liabilities (Current) | $228,878 | $266,265 | 16.3% |
| Total Current Debt | $2,202,310 | $3,098,665 | 40.7% |
| Total Debt | $2,584,188 | $3,650,601 | 41.2% |
Grafton Group plc released a trading update ahead of its Annual General Meeting, highlighting its performance for the period from January 1 to April 27, 2025. The Groups revenue increased by 7.8% year-over-year to £773.1 million, with a 9.…
| Financial Year | Revenue (£ million) | Average Daily Like-for-Like Revenue Change | Debt |
|---|---|---|---|
| 2025 | £773.1 million | 2.7% increase | Not mentioned |
| 2024 | £717.3 million | n/a | Not mentioned |
Concurrent with the <mark style="background-color:yellow">purchase</mark> of the New Ordinary Shares, the Purchaser will receive warrants from the Company on a one-for-one basis. These warrants will be exercisable for a period of 36 months…
Here is a summary of the trading statement for NEXT PLC for the first quarter of the financial year 2025/26: - NEXT PLC has released its trading statement for the first quarter of the financial year 2025/26, covering the period from Janua…
| Financial Year | Full Price Sales | Total Group Sales | NEXT Group Profit Before Tax | Pre-tax EPS | Post-tax EPS |
|---|---|---|---|---|---|
| 2025/26 (New Guidance) | £5.4bn (+6.0%) | £6.6bn (+5.0%) | £1,080m (+6.8%) | 929.6p (+10.0%) | 698.1p (+9.7%) |
| 2025/26 (Previous Guidance) | £5.3bn (+5.0%) | £6.6bn (+4.4%) | £1,066m (+5.4%) | 919.6p (+8.8%) | 690.7p (+8.5%) |
| 2024/25 | N/A | N/A | N/A | N/A | N/A |
| 2023/24 | N/A | N/A | N/A | N/A | N/A |
Chrysalis Investments Limited released its quarterly update, announcing a decrease in its unaudited net asset value per share as of March 31, 2025. The decrease is attributed to a decline in the portfolios fair value and unfavorable foreig…
| 31-Mar-2025 | 31-Dec-2024 | |
|---|---|---|
| Net Asset Value per share | 152.62 pence | 156.62 pence |
| Change in NAV per share | -4.0 pence (-2.6%) | N/A |
| Gross cash and equivalents | £114 million | N/A |
| Position in Wise | £3 million | N/A |
| Total liquidity position | £117 million | N/A |
| Gross debt | N/A | N/A |
| Net debt | N/A | N/A |
Renishaw plc, a global provider of manufacturing technologies, analytical instruments, and medical devices, released a trading update for the nine months ended March 31, 2025. The company reported solid financial performance with a 5% year…
| Financial Year | Revenue (£) | Adjusted Profit Before Tax (£) | Statutory Profit Before Tax (£) | Cash, Cash Equivalents and Bank Deposits (£) |
|---|---|---|---|---|
| Q3 FY2025 (3 months ended 31 March 2025) | 180.7m | 30.0m | 28.1m | 259.8m (as of 31 March 2025) |
| Q2 FY2025 (3 months ended 31 December 2024) | 167.5m | 23.5m | 23.5m | N/A |
| Q1 FY2025 (3 months ended 30 September 2024) | 173.9m | 34.0m | 34.0m | N/A |
| 9 months ended 31 March 2025 | 522.1m | 87.5m | 85.6m | N/A |
| 9 months ended 31 March 2024 | 502.9m | 86.8m | 86.8m | 217.8m (as of 30 June 2024) |
The London Stock Exchange plc does not endorse or verify the content on this Website, and users are responsible for ensuring its accuracy. Any news item, including prospectuses, should be relied upon only by the intended recipients and wit…
Afentra plc, an upstream oil and gas company, announces its annual report and notice of the 2025 Annual General Meeting. The report includes the audited financial statements for the year ended December 31, 2024, and the AGM will be held el…
| Year | Revenue | Cost of Sales | Gross Profit | Profit from Operations | Finance Income | Finance Costs | Profit/(Loss) Before Tax | Income Tax | Profit/(Loss) for the Year | Total Assets | Total Liabilities | Total Equity | Total Debt |
|---|---|---|---|---|---|---|---|---|---|---|---|---|---|
| 2024 | $180,860 | $94,124 | $86,736 | $74,469 | $106 | $9,000 | $65,575 | $13,225 | $52,350 | $226,608 | $127,979 | $98,629 | $41,416 |
| 2023 | $26,390 | $12,571 | $13,819 | $2,362 | $240 | $3,508 | $(906) | $1,799 | $(2,705) | $140,747 | $92,775 | $47,972 | $31,703 |
Van Elle Holdings plc, the UKs largest ground engineering contractor, has entered into a 5-year partnership with WS Specialist Logistics Limited to consolidate its heavy haulage operations. WS Specialist Logistics will manage and operate V…
Here is a summary of the document: ICG Enterprise Trust plc, a leading listed private equity investor, has released its preliminary results for the twelve months ended January 31, 2025. The companys actively-managed portfolio, focused on …
| 2021 | 2022 | 2023 | 2024 | 2025 | |
|---|---|---|---|---|---|
| Revenue | 2,874 | 43,436 | 134,540 | 135,216 | 134,540 |
| Net Income | -1,261 | 17,366 | 107,510 | 116,485 | 107,510 |
| Total Assets | 1,300,619 | 1,283,223 | 1,296,382 | 1,469,549 | 1,332,392 |
| Total Liabilities | 1,300,619 | 1,283,223 | 1,296,382 | 1,469,549 | 1,332,392 |
| Total Debt | 0 | 0 | 0 | 128,000,000 | 131,931,000 |
The ticker catalyst tape is rendered as native mobile cards. Articles and ticker links stay clickable.
RGO
RiverFort Global Opportunities PLC
IPO
IP Group
ANTO
Antofagasta PLC
FEV
Fidelity European Values
FSFL
Foresight Solar Fund Ltd
ROO
Deliveroo Holdings PLC
BARC
Barclays PLC
SMWH
WH Smith PLC
ROO
Deliveroo Holdings PLC
BEZ
Beazley plc
JD.
JD.
IMB
Imperial Brands PLC
LGEN
Legal & General Group PLC
IMI
IMI PLC
33JE
33JE
SPT
Spirent Communications plc
DRX
Drax Group PLC
MER
Mears Group plc
THRG
Throgmorton Trust Plc
CORO
Coro Energy PLC
PSON
Pearson PLC
BRGE
BlackRock Greater Europe Investment Trust plc
FSFL
Foresight Solar Fund Ltd
BNKR
Bankers Investment Trust
SMIN
Smiths Group PLC
SSON
Smithson Investment Trust PLC
JUP
Jupiter Fund Management Plc
HSBA
HSBC Holdings PLC
EDV
Endeavour Mining Corp
ABF
Associated British Foods PLC
XGLD
Xtrackers Physical Gold ETC
JDG
Judges Scientific Plc
CTY
City Of London Investment Trust
TXP
Touchstone Exploration Inc
SHRS
Shires Income
CVSG
CVS Group Plc
AHT
Ashtead Group PLC
OXA1
Db Etc Plc
DIG
Dunedin Income Growth Investment Trust PLC
AUSC
Abrdn UK Smaller Companies Growth Trust PLC
ANII
Aberdeen New India Investment Trust PLC
AAIF
abrdn Asian Income Fund Limited
PPH
PPHE Hotel Group Ltd
BRWM
Blackrock World Mining Trust Plc
AAS
Abrdn Asia Focus PLC
BGEO
Lion Finance Group PLC
LLOY
Lloyds Banking Group PLC
ADIG
Aberdeen Diversified Income and Growth Trust PLC
33JE
33JE
GSK
GSK plc
LWI
Lowland Investment Co
FAS
Fidelity Asian Values
MTU
Montanaro UK Smaller Companies Investment Trust PLC
JAGI
JPMorgan Asia Growth & Income plc
IEM
Impax Environmental Markets PLC
ALW
Alliance Witan Ord
IAD
Invesco Asia Dragon Trust plc
SST
The Scottish Oriental Smaller Companies Trust plc
JEDT
JPMorgan Euro Small Companies Trust Plc
HSL
Henderson Smaller Cos Inv Tst
PGH
Personal Group Holdings PLC
BHMG
BH Macro Limited
JMG
JPMorgan Emerging Markets Ord
PCT
Polar Capital Technology Trust
0RYA
Ryanair Holdings plc
MNL
Manchester and London Investment Trust plc
JAM
JPMorgan American Investment Trust
SHEL
Shell plc
PAG
Paragon Banking Group PLC
BGUK
Baillie Gifford UK Growth Fund PLC
CTUK
CT UK Capital And Income Investment Trust Plc
PAC
Pacific Assets Trust plc
NCYF
CQS New City High Yield Fund
BGS
Baillie Gifford Shin Nippon PLC
REL
Relx PLC
JEMI
JPMorgan Global Emerging Markets Investment Trust PLC
TEM
Templeton Emerging Markets Investment Trust TEMIT
SEC
Strategic Equity Capital Closed Fund
GSCT
The Global Smaller Companies Trust Plc
SREI
Schroder Real Estate Investment Trust Ltd
FEML
Fidelity Emerging Markets Ord
CGT
Capital Gearing Trust
MONY
MONY Group plc
UPL
Upland Resources Ltd
EWI
Edinburgh Worldwide Investment Trust plc
CRH
CRH PLC
FCH
Funding Circle Holdings PLC
MPAC
MPAC Group PLC
HWDN
Howden Joinery Group Plc
JUSC
JPmorgan US Smaller Companies Investment Trust PLC
EPWN
Epwin Group PLC
SMT
Scottish Mortgage Investment Trust plc
HFEL
Henderson Far East Income Ltd
MNKS
Monks Investment Trust PLC
UEM
Utilico Emerging Markets Ltd
BGFD
Baillie Gifford Japan Trust
RKT
Reckitt Benckiser Group PLC
MAI
Maintel Holdings Plc
CRTA
Cirata plc
88E
88 Energy Ltd
STJ
St. Jamess Place plc
LTOD
Larsen & Toubro Limited
ABDN
Abrdn PLC
HIK
Hikma Pharmaceuticals PLC
51DV
51DV
VSL
VPC Specialty Lending Investments PLC
SYNC
Syncona Limited
LSL
LSL Property Services Plc
OAP3
Octopus Apollo VCT PLC
CMPG
CT Global Managed Portfolio Trust PLC
OAP3
Octopus Apollo VCT PLC
CMPI
CT Global Managed Portfolio Trust PLC
NAIT
The North American Income Trust plc
SORT
Sorted Group Holdings Plc
MIRI
Mirriad Advertising PLC
OIT
Odyssean Investment Trust PLC
CRN
Cairn Homes PLC
CSSG
Croma Security Solutions Group Plc
MNDI
Mondi PLC
IRSH
IRSH
GBG
GB Group plc
JUST
Just Group plc
IRSH
IRSH
WIX
Wickes Group PLC
FCIT
F&C Investment Trust PLC
FCIT
F&C Investment Trust PLC
BARC
Barclays PLC
FCIT
F&C Investment Trust PLC
ICGC
Irish Continental Group plc
71LF
71LF
GSK
GSK plc
TRN
Trainline Plc
IHG
InterContinental Hotels Group PLC
HAN
Hansa Trust
HAN
Hansa Trust
0QZ3
Qualcomm Inc.
AWE
Alphawave IP Group PLC
SPT
Spirent Communications plc
DWL
Dowlais Group Plc
DLG
Direct Line Insurance Group plc
AV.
AV.
DWL
Dowlais Group Plc
RWI
Renewi PLC
DWL
Dowlais Group Plc
HRI
Herald Investment Trust
OIT
Odyssean Investment Trust PLC
SWR
Smurfit Westrock Plc
HSW
Hostelworld Group PLC
BARC
Barclays PLC
SPT
Spirent Communications plc
BARC
Barclays PLC
BARC
Barclays PLC
BARC
Barclays PLC
BARC
Barclays PLC
AAIF
abrdn Asian Income Fund Limited
RWI
Renewi PLC
DWL
Dowlais Group Plc
SPT
Spirent Communications plc
BARC
Barclays PLC
CCR
C&C Group plc
GFTU
Grafton Group plc
QLT
Quilter PLC
QLT
Quilter PLC
QLT
Quilter PLC
CHI
CT UK High Income Ord
AV.
AV.
RWI
Renewi PLC
AV.
AV.
FDM
FDM Group Holdings PLC
DLG
Direct Line Insurance Group plc
GOT
Global Opportunities Trust Ord
DWL
Dowlais Group Plc
BARC
Barclays PLC
BARC
Barclays PLC
BARC
Barclays PLC
BARC
Barclays PLC
BARC
Barclays PLC
BARC
Barclays PLC
SE77
SE77
RAT
Rathbone Brothers PLC
RAT
Rathbone Brothers PLC
RAT
Rathbone Brothers PLC
0QZ3
Qualcomm Inc.
FLTR
Flutter Entertainment PLC
RAT
Rathbone Brothers PLC
DLG
Direct Line Insurance Group plc
BNZL
Bunzl PLC
AV.
AV.
DWL
Dowlais Group Plc
TRIG
Renewables Infrastructure Grp
BARC
Barclays PLC
BAKK
Bakkavor Group PLC
RAT
Rathbone Brothers PLC
LMP
LondonMetric Property Plc
RAT
Rathbone Brothers PLC
STAN
Standard Chartered PLC
SHED
Urban Logistics Reit PLC
RAT
Rathbone Brothers PLC
INDV
Indivior PLC
LMP
LondonMetric Property Plc
RAT
Rathbone Brothers PLC
JUP
Jupiter Fund Management Plc
CRT
Care REIT plc
ROO
Deliveroo Holdings PLC
WHR
Warehouse REIT plc
FEN
Frenkel Topping Group
DWL
Dowlais Group Plc
STAN
Standard Chartered PLC
ITX
Itaconix plc
BAKK
Bakkavor Group PLC
BARC
Barclays PLC
SPT
Spirent Communications plc
GNC
Greencore Group
AV.
AV.
BARC
Barclays PLC
UPR
Uniphar Group PLC
JDW
J D Wetherspoon PLC
SCP
Schroder UK Mid Cap Fund PLC
RAT
Rathbone Brothers PLC
IRSH
IRSH
INDV
Indivior PLC
LSL
LSL Property Services Plc
AIRE
Alternative Income REIT PLC
HBR
Harbour Energy PLC
IRSH
IRSH
BARC
Barclays PLC
MNG
M&G Plc
JGGI
JP Morgan Global Growth & Income PLC
DAL
Dalata Hotel Group plc
MAV4
Maven Income and Growth VCT 4 PLC
BFSP
Blackfinch Spring VCT PLC
IRSH
IRSH
FE80
FE80
IRSH
IRSH
TSCO
Tesco PLC
BOOM
Audioboom Group plc
BARC
Barclays PLC
MRL
Marlowe plc
BARC
Barclays PLC
LAND
Land Securities Group PLC
SPT
Spirent Communications plc
MGAM
Morgan Advanced Materials plc
PAF
Pan African Resources PLC
NG.
NG.
BATS
British American Tobacco PLC
BATS
British American Tobacco PLC
0UKI
Bank of Nova Scotia
BARC
Barclays PLC
BARC
Barclays PLC
BARC
Barclays PLC
BARC
Barclays PLC
BARC
Barclays PLC
BARC
Barclays PLC
CGEO
Georgia Capital PLC
CNA
Centrica PLC
SOS
Sosandar Plc
IMI
IMI PLC
GYM
The GYM Group PLC
IRSH
IRSH
IRSH
IRSH
CAU
Centaur Media
PODP
Pod Point Group Holdings PLC
PEN
Pennant International Group plc
TGA
Thungela Resources Limited
MGCI
M&G Credit Income Investment Trust PLC
94WF
94WF
OSB
OneSavings Bank PLC
RAT
Rathbone Brothers PLC
BOWL
Hollywood Bowl Group PLC
ELIX
Elixirr International Plc
94WF
94WF
ROSE
Rosebank Industries PLC
0NVC
Danske Bank A/S
PPH
PPHE Hotel Group Ltd
NLB
Nova Ljubljanska Banka d.d.
GENL
Genel Energy Plc
BATS
British American Tobacco PLC
FLTR
Flutter Entertainment PLC
BBY
Balfour Beatty plc
RWS
RWS Holdings PLC
HKLD
HONGKONG LAND HLDGS
ALPH
Alpha Group International plc
IXI
IXICO PLC
YZ61
YZ61
YZ61
YZ61
POLR
Polar Capital Holdings plc
ABDN
Abrdn PLC
RAT
Rathbone Brothers PLC
GSK
GSK plc
IRSH
IRSH
IRSH
IRSH
JDW
J D Wetherspoon PLC
BRK
Brooks Macdonald Group
STAN
Standard Chartered PLC
SPX
Spirax Group plc
87FZ
AECI Ltd
IDS
International Distributions Services PLC
QLT
Quilter PLC
BBB
Bigblu Broadband PLC
JAR
Jardine Matheson Holdings Limited
HIK
Hikma Pharmaceuticals PLC
HHPD
Hon Hai Precision Industry Co Ltd ADR
IRSH
IRSH
IRSH
IRSH
CTG
Christie Group plc
XGDU
Xtrackers IE Physical Gold ETC
IRSH
IRSH
SDV
Chelverton UK Dividend Trust PLC
IRSH
IRSH
IRSH
IRSH
IRSH
IRSH
SYM
Symphony Environmental Technologies plc
0Q0J
0Q0J
DFCH
Distribution Finance Capital Holdings PLC
SDR
Schroders PLC
JEGI
JPMorgan European Growth & Income plc
MONY
MONY Group plc
SF22
SF22
INVP
Investec PLC
PRU
Prudential plc
ALFA
Alfa Financial Software Holdings PLC
INVP
Investec PLC
LUCE
Luceco plc
3IN
3I Infrastructure PLC
PRU
Prudential plc
3IN
3I Infrastructure PLC
INVP
Investec PLC
REVB
Revolution Beauty Group PLC
UPR
Uniphar Group PLC
INVP
Investec PLC
INVP
Investec PLC
ACID
Acer Incorporated
CNA
Centrica PLC
GABI
Project Finance Investments Limited
AV.
AV.
GCL
Geiger Counter Limited
NWOR
National World PLC
CRH
CRH PLC
HSW
Hostelworld Group PLC
EKF
EKF Diagnostics Holdings Plc
ANTO
Antofagasta PLC
TYT
Toyota Motor Corp
HHPD
Hon Hai Precision Industry Co Ltd ADR
KNM
Konami Holdings Corp
KNM
Konami Holdings Corp
KNM
Konami Holdings Corp
MGNS
Morgan Sindall Group PLC
IRSH
IRSH
UFO
Alien Metals Ltd
AVAP
Avation PLC
IRSH
IRSH
HIK
Hikma Pharmaceuticals PLC
TYT
Toyota Motor Corp
TYT
Toyota Motor Corp
TYT
Toyota Motor Corp
ZOO
Zoo Digital Group Plc
| Year | Revenue | EBITDA | Net Cash | Cost Savings |
|---|---|---|---|---|
| FY25 | $49.4 million | At least $0.1 million | $2.6 million | $6.8 million |
| FY24 | N/A | Loss of $13.6 million | N/A | N/A |
TYT
Toyota Motor Corp
YZ61
YZ61
YZ61
YZ61
YZ61
YZ61
AVCT
Avacta Group PLC
BARC
Barclays PLC
RBD
Reabold Resources Plc
PCTN
Picton Property Income Ltd
0A3F
0A3F
0A3D
iShares VII Public Limited Company - iShares Core S&P 500 UCITS ETF
0A3E
0A3E
0A3G
0A3G
CMB1
iShares FTSE MIB UCITS
BBY
Balfour Beatty plc
KMK
Kromek Group PLC
IAG
International Consolidated Airlines Group S.A
TRST
Trustpilot Group PLC
MGAM
Morgan Advanced Materials plc
ZOO
Zoo Digital Group Plc
PU26
PU26
DEC
Diversified Energy Company PLC
FLTR
Flutter Entertainment PLC
IWG
IWG PLC
CHRY
Chrysalis Investments Ltd
GROW
Draper Esprit PLC
GENL
Genel Energy Plc
CREI
Custodian REIT PLC
RM.
RM.
MTRO
Metro Bank PLC
CRN
Cairn Homes PLC
| Year | Revenue Growth | Operating Profit | ROE | Debt |
|---|---|---|---|---|
| 2025 | In excess of 10% | €160 million | c.15.5% | Not mentioned |
| 2024 | Not mentioned | Not mentioned | Not mentioned | Not mentioned |
APAX
Apax Global Alpha Ltd
TIA
Tialis Essential IT PLC
INSG
Insig Ai PLC
KETL
Strix Group Plc
SAV
Savannah Resources Plc
SSIT
Seraphim Space Investment Trust PLC
ANIC
Agronomics Ltd
JUSC
JPmorgan US Smaller Companies Investment Trust PLC
MNL
Manchester and London Investment Trust plc
FAB
Fusion Antibodies PLC
ENSI
EnSilica PLC
MTEC
Made Tech Group PLC
OBI
Ondine Biomedical Inc
HGT
HG Capital Trust PLC
SREI
Schroder Real Estate Investment Trust Ltd
LIKE
Likewise Group PLC
EGY
VAALCO Energy Inc
BIG
Big Technologies PLC
SPEC
Inspecs Group plc
ROAD
Roadside Real Estate plc
BBH
Bellevue Healthcare Trust PLC
BBOX
Tritax Big Box REIT plc
GFTU
Grafton Group plc
GTC
Getech Group
BSRT
Baker Steel Resources Trust
DNLM
Dunelm Group PLC
CTA
CT Automotive Group PLC
TBCG
TBC Bank Group PLC
SUOP
iShares $ Corp Bond ESG UCITS ETF GBP Hedged Inc
DHYG
iShares $ High Yield Corp Bond ESG UCITS ETF GBP Hedged Dist
EMES
iShares J.P. Morgan ESG $ EM Bond UCITS ETF USD (Dist)
SUOG
iShares € Corp Bond ESG UCITS ETF GBP Hedged Inc
SUOE
iShares € Corp Bond ESG UCITS ETF EUR (Dist)
EFRN
iShares € Floating Rate Bond ESG UCITS ETF EUR (Dist)
FLOS
iShares $ Floating Rate Bond UCITS ETF
FLOT
iShares II Public Limited Company - iShares $ Floating Rate Bond UCITS ETF
WQDV
iShares MSCI World Quality Dividend ESG UCITS ETF USD (Dist)
TI5G
iShares $ TIPS 0-5 UCITS ETF GBP Hedged (Dist)
TIP5
iShares $ TIPS 0-5 UCITS Dist Share Class
SGSU
iShares $ Corp Bond 0-3yr ESG UCITS ETF GBP Hedged (Dist)
SUSU
iShares $ Corp Bond SRI 0-3yr UCITS ETF USD (Dist)
QDIV
iShares MSCI USA Dividend IQ UCITS
IUGA
iShares US Aggregate Bond UCITS ETF
IUAG
iShares US Aggregate Bond UCITS ETF USD (Dist)
IHHG
iShares $ High Yield Corp Bond UCITS ETF GBP Hedged (Dist)
IHYU
iShares High Yield Corporate Bond UCITS
DLTM
iShares II Public Limited Company - iShares MSCI EM Latin America UCITS ETF
DPYG
iShares Developed Markets Property Yield UCITS ETF GBP Hedged (Dist)
IDWP
iShares Developed Markets Property Yield UCITS
IDUP
iShares US Property Yield UCITS ETF USD (Dist)
IUKP
iShares UK Property UCITS
ITPG
iShares II Public Limited Company - iShares $ TIPS UCITS ETF
IDTK
iShares MSCI Turkey UCITS ETF USD (Dist)
ISDW
iShares MSCI World Islamic UCITS
ISDU
iShares MSCI USA Islamic UCITS
ISDE
iShares MSCI Emerging Markets Islamic UCITS
IDPE
iShares Listed Private Equity UCITS ETF USD (Dist)
INXG
iShares £ Index-Linked Gilts UCITS ETF GBP (Dist)
IDIN
iShares Global Infrastructure UCITS ETF USD (Dist)
DH2O
iShares Global Water UCITS
IGLT
iShares Core UK Gilts UCITS
EMHG
iShares J.P. Morgan $ EM Bond UCITS ETF GBP Hedged (Dist)
IEMB
iShares J.P. Morgan $ EM Bond UCITS ETF USD (Dist)
IGTM
iShares $ Treasury Bond 7-10yr UCITS ETF USD
DBRC
iShares BRIC 50 UCITS
IDTM
iShares II Public Limited Company - iShares $ Treasury Bond 7-10yr UCITS ETF
IBGM
iShares Euro Government Bond 7-10yr UCITS ETF EUR (Dist)
IDAR
iShares Asia Property Yield UCITS ETF USD (Dist) USD
EMBE
iShares J.P. Morgan Emerging Markets Bond EUR Hedged UCITS
AAF
Airtel Africa Plc
| Year | Revenue | Operating Profit | Profit/Loss After Tax | EPS (Basic) | Capex | Net Debt | Leverage |
|---|---|---|---|---|---|---|---|
| 2025 | $4,955m | $1,457m | $328m | 6.0 cents | $670m | $5,363m | 2.3x |
| 2024 | $4,979m | $1,640m | $(89)m | (4.4) cents | $737m | $3,505m | 1.4x |
MTL
Metals Exploration Plc
TXP
Touchstone Exploration Inc
WSBN
Wishbone Gold Plc
0A28
Prosus N.V.
PEY
Princess Private Equity Holding Ltd
MSMN
Mosman Oil and Gas Ltd
STAN
Standard Chartered PLC
FLTR
Flutter Entertainment PLC
| Financial Metrics | Q1 2025 | Q1 2024 | YoY Change | ||||
|---|---|---|---|---|---|---|---|
| Amount | % | Amount | % | % | |||
| Average Monthly Players (AMPs) | 14,880 | 13,722 | +8% | ||||
| Revenue | $3,665 million | $3,397 million | +8% | ||||
| Net Income | $335 million | $(177) million | +289% | ||||
| Net Income Margin | 9.1% | (5.2)% | +1,440 bps | ||||
| Adjusted EBITDA | $616 million | $514 million | +20% | ||||
| Adjusted EBITDA Margin | 16.8% | 15.1% | +170 bps | ||||
| Earnings per Share | $1.57 | $(1.10) | +243% | ||||
| Adjusted Earnings per Share | $1.59 | $1.05 | +51% | ||||
| Net Cash from Operating Activities | $188 million | $337 million | (44)% | ||||
| Free Cash Flow | $88 million | $185 million | (52)% | ||||
BEM
Beowulf Mining
AIBG
AIB Group PLC
PTAL
Petrotal Corp
CNC
Concurrent Technologies Plc
PULS
Pulsar Group plc
TRCS
Tracsis Plc
HBR
Harbour Energy PLC
KMK
Kromek Group PLC
| Full Year 2025 | Full Year 2024 | |
|---|---|---|
| Revenue | Not less than £26 million | N/A |
| Year-on-Year Revenue Growth | At least 34% growth | N/A |
| Profit Before Tax | Slightly ahead of market expectations | N/A |
| Group Debt | £0.5 million | £12.3 million |
MIRI
Mirriad Advertising PLC
CCEP
Coca-Cola Europacific Partners PLC
IMI
IMI PLC
| Financial Metric | 2025 | 2024 | Change |
|---|---|---|---|
| Group Organic Revenue | 3% lower | N/A | N/A |
| Adjusted Revenue | 5% lower | N/A | N/A |
| Group Margins | Improved | N/A | N/A |
| Automation Revenue | 4% lower | N/A | N/A |
| Process Automation Revenue | 1% lower | 27% growth | Negative Change |
| Process Automation Orders | 7% increase | N/A | N/A |
| Aftermarket Orders | 19% increase | N/A | N/A |
| Industrial Automation Revenue | 7% lower | N/A | N/A |
| Life Technology Revenue | 2% lower | N/A | N/A |
| Climate Control Revenue | 4% higher | N/A | N/A |
| Life Science and Fluid Control Revenue | Flat | N/A | N/A |
| Transport Revenue | 16% lower | 19% growth | Negative Change |
| Adjusted Basic Earnings per Share CAGR | 11% | N/A | N/A |
| Amount Returned to Shareholders | £650m | N/A | N/A |
| Share Buyback | £200m | N/A | N/A |
| Impact of Exchange Rates on Revenue and Adjusted Operating Profit | 2% negative impact | N/A | N/A |
| Full Year Adjusted EPS Guidance | 129p-136p | N/A | N/A |
| Weighted Average Number of Shares | Around 249 million | N/A | N/A |
GEX
Georgina Energy PLC
SFOR
S4 Capital PLC
| Financial Metrics | Q1 2025 | Change Reported | Change Like-for-Like | Change Pro-forma | Q1 2024 |
|---|---|---|---|---|---|
| Billings | £463.3 million | 7.7% | 8.6% | 8.6% | £430.1 million |
| Revenue | £178.1 million | -15.3% | -14.3% | -14.3% | £210.2 million |
| Net Revenue | £163.7 million | -12.2% | -11.4% | -11.4% | £186.4 million |
| Net Debt | £144.8 million | N/A | N/A | N/A | £206.0 million |
| Net Revenue by Segment | Q1 2025 | Change Reported | Change Like-for-Like | Q1 2024 |
|---|---|---|---|---|
| Marketing Services | £148.3 million | -8.6% | -7.5% | £162.2 million |
| Technology Services | £15.4 million | -36.4% | -36.9% | £24.2 million |
| Net Revenue by Geography | Q1 2025 | Change Reported | Change Like-for-Like | Q1 2024 |
|---|---|---|---|---|
| Americas | £130.5 million | -11.0% | -10.5% | £146.7 million |
| EMEA | £24.3 million | -17.3% | -15.9% | £29.4 million |
| Asia-Pacific | £8.9 million | -13.6% | -11.0% | £10.3 million |
FRP
Frp Advisory Group Plc
CNE
Capricorn Energy PLC
GEM
Gemfields Plc
CHRY
Chrysalis Investments Ltd
CNA
Centrica PLC
AREC
Arecor Therapeutics PLC
IHG
InterContinental Hotels Group PLC
GST
GSTechnologies Ltd
SBDS
Silver Bullet Data Services Group PLC
LORD
Lords Grp Trading Plc
| Year | Revenue | Adjusted EBITDA | Adjusted Operating Profit | Net Debt |
|---|---|---|---|---|
| 2024 | £436.7m | £22.4m | £10.4m | £32.4m |
| 2023 | £462.6m | £26.8m | £16.5m | £28.5m |
| Change | (5.6)% | (16.5)% | (37.0)% | +13.5% |
OCI
Oakley Capital Investments Limited
MXCT
MaxCyte Inc
| Financial Metric | Q1 2025 | Q1 2024 | Change |
|---|---|---|---|
| Total Revenue | $10.4 million | $11.3 million | -8% |
| Core Business Revenue | $8.2 million | $8.2 million | 1% |
| SPL Program-related Revenue | $2.1 million | $3.2 million | -32% |
| Gross Profit | $8.9 million | $9.9 million | N/A |
| Gross Margin | 86% | 88% | N/A |
| Operating Expenses | $21.2 million | $22.2 million | N/A |
| Net Loss | $10.3 million | $9.5 million | N/A |
| EBITDA | Loss of $11.2 million | Loss of $11.2 million | N/A |
| Cash, Cash Equivalents, and Investments | $174.7 million | N/A | N/A |
3IN
3I Infrastructure PLC
| Year | Total Return | Total Income | Total Liquidity | Net Debt |
|---|---|---|---|---|
| 2025 | £333m | £204m | £644m | £256m |
| 2024 | £347m | £194m | £395m | £505m |
APAX
Apax Global Alpha Ltd
VOD
Vodafone Group PLC
HTWS
Helios Towers Plc
| Financial Metrics | Q1 2025 | Q1 2024 | Change | Q1 2025 | Q4 2024 | Change |
|---|---|---|---|---|---|---|
| Sites | 14,417 | 14,166 | +2% | 14,417 | 14,325 | +1% |
| Tenancies | 30,074 | 27,686 | +9% | 30,074 | 29,406 | +2% |
| Tenancy Ratio | 2.09x | 1.95x | +0.14x | 2.09x | 2.05x | +0.04x |
| Revenue (US$m) | 203.8 | 194.6 | +5% | 203.8 | 207.3 | -2% |
| Adjusted EBITDA (US$m) | 111.1 | 102.2 | +9% | 111.1 | 109.1 | +2% |
| Adjusted EBITDA Margin | 55% | 53% | +2ppt | 55% | 53% | +2ppt |
| Operating Profit (US$m) | 76.6 | 67.3 | +14% | 76.6 | 51.7 | +48% |
| ROIC | 13.8% | 12.6% | +1.2ppt | 13.8% | 12.9% | +0.9ppt |
| Free Cash Flow (US$m) | 1.5 | -27.7 | +29.2 | 1.5 | 39.8 | -38.3 |
| Net Debt (US$m) | 1,768.5 | 1,812.1 | -2% | 1,768.5 | 1,735.5 | +2% |
| Net Leverage | 4.0x | 4.4x | -0.4x | 4.0x | 4.0x | 0 |
ULVR
Unilever PLC
EMG
Man Group PLC
TUN
Tungsten West PLC
KGF
Kingfisher PLC
HLN
Haleon PLC
DFCH
Distribution Finance Capital Holdings PLC
CPP
CPPGroup Plc
HSX
Hiscox Ltd
PAY
PayPoint plc
POLX
Polarean Imaging Plc
| Financial Metrics | FY 2023 | FY 2024 | Change |
|---|---|---|---|
| Revenue | $890,933 | $3,089,957 | 246.9% |
| Cost of Sales | $555,450 | $1,666,667 | 201.0% |
| Gross Profit | $335,483 | $1,423,290 | 324.2% |
| Administrative Expenses | $3,337,836 | $3,102,331 | -7.1% |
| Research, Development & Regulatory Expenses | $4,194,006 | $3,440,590 | -17.9% |
| Depreciation | $208,786 | $254,993 | 22.1% |
| Amortization | $728,411 | $710,058 | -2.5% |
| Selling & Distribution Expenses | $3,562,412 | $1,950,755 | -45.2% |
| Share-Based Payment Expense | $860,195 | $713,895 | -17.0% |
| Total Operating Costs | $12,891,646 | $10,172,622 | -21.1% |
| Operating Loss | $12,556,163 | $8,749,332 | -30.3% |
| Finance Income | $298,899 | $274,838 | -8.0% |
| Finance Expense | $15,990 | $16,178 | 1.1% |
| Other Losses/Gains - Net | $388,451 | $(49,300) | -113.4% |
| Loss Before Tax | $11,884,803 | $8,539,972 | -28.1% |
| Taxation | $0 | $0 | 0.0% |
| Loss for the Year | $11,884,803 | $8,539,972 | -28.1% |
| Net Cash | $6,171,636 | $12,111,708 | 96.2% |
| Debt | FY 2023 | FY 2024 | Change |
|---|---|---|---|
| Lease Liability (Non-Current) | $74,846 | $374,265 | 400.5% |
| Trade & Other Payables (Non-Current) | $240,000 | $120,000 | -50.0% |
| Contract Liabilities (Non-Current) | $67,032 | $56,771 | -15.3% |
| Total Non-Current Debt | $381,878 | $551,036 | 44.2% |
| Lease Liability (Current) | $141,845 | $129,521 | -8.7% |
| Trade & Other Payables (Current) | $1,831,587 | $2,702,879 | 47.5% |
| Contract Liabilities (Current) | $228,878 | $266,265 | 16.3% |
| Total Current Debt | $2,202,310 | $3,098,665 | 40.7% |
| Total Debt | $2,584,188 | $3,650,601 | 41.2% |
IAG
International Consolidated Airlines Group S.A
PLUS
Plus500 Ltd
GFTU
Grafton Group plc
| Financial Year | Revenue (£ million) | Average Daily Like-for-Like Revenue Change | Debt |
|---|---|---|---|
| 2025 | £773.1 million | 2.7% increase | Not mentioned |
| 2024 | £717.3 million | n/a | Not mentioned |
TCAP
TP ICAP Group PLC
BBY
Balfour Beatty plc
INCH
Inchcape PLC
HEMO
Hemogenyx Pharmaceuticals PLC
GSK
GSK plc
PGH
Personal Group Holdings PLC
GBG
GB Group plc
WOSG
Watches Of Switzerland Group PLC
BATS
British American Tobacco PLC
FGEN
Foresight Environmental Infrastructure Limited
TET
Treatt PLC
TRN
Trainline Plc
ACSO
Accesso Technology Group PLC
RCP
RIT Capital Partners
PRU
Prudential plc
NXT
Next PLC
| Financial Year | Full Price Sales | Total Group Sales | NEXT Group Profit Before Tax | Pre-tax EPS | Post-tax EPS |
|---|---|---|---|---|---|
| 2025/26 (New Guidance) | £5.4bn (+6.0%) | £6.6bn (+5.0%) | £1,080m (+6.8%) | 929.6p (+10.0%) | 698.1p (+9.7%) |
| 2025/26 (Previous Guidance) | £5.3bn (+5.0%) | £6.6bn (+4.4%) | £1,066m (+5.4%) | 919.6p (+8.8%) | 690.7p (+8.5%) |
| 2024/25 | N/A | N/A | N/A | N/A | N/A |
| 2023/24 | N/A | N/A | N/A | N/A | N/A |
BIRG
Bank of Ireland Group PLC
MOTR
Motorpoint Group PLC
CNA
Centrica PLC
JET2
Jet2 PLC
BTRW
Barratt Redrow plc
TSCO
Tesco PLC
MONY
MONY Group plc
RKT
Reckitt Benckiser Group PLC
DWL
Dowlais Group Plc
POLN
Pollen Street PLC
N91
Ninety One PLC
IWG
IWG PLC
GLEN
Glencore PLC
UPR
Uniphar Group PLC
VTY
Vistry Group PLC
KYGA
Kerry Group
KIE
Kier Group PLC
CCR
C&C Group plc
CHRY
Chrysalis Investments Ltd
| 31-Mar-2025 | 31-Dec-2024 | |
|---|---|---|
| Net Asset Value per share | 152.62 pence | 156.62 pence |
| Change in NAV per share | -4.0 pence (-2.6%) | N/A |
| Gross cash and equivalents | £114 million | N/A |
| Position in Wise | £3 million | N/A |
| Total liquidity position | £117 million | N/A |
| Gross debt | N/A | N/A |
| Net debt | N/A | N/A |
RSW
Renishaw PLC
| Financial Year | Revenue (£) | Adjusted Profit Before Tax (£) | Statutory Profit Before Tax (£) | Cash, Cash Equivalents and Bank Deposits (£) |
|---|---|---|---|---|
| Q3 FY2025 (3 months ended 31 March 2025) | 180.7m | 30.0m | 28.1m | 259.8m (as of 31 March 2025) |
| Q2 FY2025 (3 months ended 31 December 2024) | 167.5m | 23.5m | 23.5m | N/A |
| Q1 FY2025 (3 months ended 30 September 2024) | 173.9m | 34.0m | 34.0m | N/A |
| 9 months ended 31 March 2025 | 522.1m | 87.5m | 85.6m | N/A |
| 9 months ended 31 March 2024 | 502.9m | 86.8m | 86.8m | 217.8m (as of 30 June 2024) |
WTB
Whitbread PLC
LSEG
London Stock Exchange Group PLC
GLV
Glenveagh Properties PLC
IGG
IG Group Holdings PLC
PIN
Pantheon International PLC
GFTU
Grafton Group plc
WIL
Wilmington PLC
HMSO
Hammerson PLC
FUTR
Future PLC
STEM
SThree plc
DORE
Downing Renewables & Infrastructure Trust PLC
ORIT
Octopus Renewables Infra Trust
CHP
Caledonian Holdings PLC
APTD
Aptitude Software Group PLC
CAM
Camellia Plc
THRL
Target Healthcare REIT Ltd
IRSH
IRSH
SAG
Science Group plc
SBRY
J Sainsbury PLC
KNOS
Kainos Group PLC
SEQI
Sequoia Econ Infrastructure
ULTP
Ultimate Products Plc
UKW
Greencoat UK Wind PLC
INF
Informa PLC
TRIG
Renewables Infrastructure Grp
HICL
HICL Infrastructure Company Ltd
INPP
International Public Partnership
RR.
RR.
GEO
Geo Exploration Limited
SYNC
Syncona Limited
KLR
Keller Group PLC
CLDN
Caledonia Investments
DLN
Derwent London PLC
MGAM
Morgan Advanced Materials plc
BBH
Bellevue Healthcare Trust PLC
FEVR
Fevertree Drinks Plc
STJ
St. Jamess Place plc
QQ.
QQ.
MRO
Melrose Industries PLC
WIX
Wickes Group PLC
ROR
Rotork PLC
BA.
BA.
JSG
Johnson Service Group Plc
MBH
Michelmersh Brick Holdings Plc
ELCO
Eleco PLC
CVCE
CVC Income & Growth Limited
RTW
RTW Venture Fund Ltd
ITM
ITM Power
TBCG
TBC Bank Group PLC
EOT
European Opportunities Trust plc
AET
Afentra PLC
| Year | Revenue | Cost of Sales | Gross Profit | Profit from Operations | Finance Income | Finance Costs | Profit/(Loss) Before Tax | Income Tax | Profit/(Loss) for the Year | Total Assets | Total Liabilities | Total Equity | Total Debt |
|---|---|---|---|---|---|---|---|---|---|---|---|---|---|
| 2024 | $180,860 | $94,124 | $86,736 | $74,469 | $106 | $9,000 | $65,575 | $13,225 | $52,350 | $226,608 | $127,979 | $98,629 | $41,416 |
| 2023 | $26,390 | $12,571 | $13,819 | $2,362 | $240 | $3,508 | $(906) | $1,799 | $(2,705) | $140,747 | $92,775 | $47,972 | $31,703 |
ECEL
Eurocell PLC
RAT
Rathbone Brothers PLC
VANL
Van Elle Holdings PLC
SE77
SE77
IPC
International Paper Company
VEIL
Vietnam Enterprise Investments Limited
VOF
VinaCapital Vietnam Opportunity Fund
SE77
SE77
IMB
Imperial Brands PLC
IHG
InterContinental Hotels Group PLC
BEZ
Beazley plc
MNDI
Mondi PLC
MOON
Moonpig Group PLC
BRWM
Blackrock World Mining Trust Plc
THRG
Throgmorton Trust Plc
BOY
Bodycote PLC
BRGE
BlackRock Greater Europe Investment Trust plc
IRSH
IRSH
ICGT
ICG Enterprise Trust PLC
| 2021 | 2022 | 2023 | 2024 | 2025 | |
|---|---|---|---|---|---|
| Revenue | 2,874 | 43,436 | 134,540 | 135,216 | 134,540 |
| Net Income | -1,261 | 17,366 | 107,510 | 116,485 | 107,510 |
| Total Assets | 1,300,619 | 1,283,223 | 1,296,382 | 1,469,549 | 1,332,392 |
| Total Liabilities | 1,300,619 | 1,283,223 | 1,296,382 | 1,469,549 | 1,332,392 |
| Total Debt | 0 | 0 | 0 | 128,000,000 | 131,931,000 |
MTC
Mothercare PLC
KMR
Kenmare Resources PLC
ICGC
Irish Continental Group plc
NBPE
NB Private Equity Partners Ltd
FSG
Foresight Group Holdings Limited
GNC
Greencore Group
IRSH
IRSH
AI sentiment, signals and catalyst scoring — loaded fresh from the site engine for the selected ticker.
London stocks ended mixed as investors reacted to the Bank of England's "hawkish" rate cut and a US-UK trade deal. The FTSE 100 closed 0.3% lower, while the FTSE 250 and AIM All-Share indices rose 0.61% and 1.0…
European equities rose on Thursday, following a Bank of England interest rate cut and US-UK trade deal expectations. The BoE lowered the bank rate by 25 basis points to 4.25%, with a split vote among the moneta…
8th May 2025 09:57 The following London-listed shares received analyst recommendations Thursday morning and on Wednesday: FTSE 100 Goldman Sachs cuts Shell price target to 40 (42) EUR - 'buy' Goldma…
European stocks opened higher on Thursday, with varying gains across major indices. The FTSE 100, FTSE 250, and AIM All-Share all posted modest gains, while the Cboe UK indices also rose. In Paris and Frank…
London's FTSE 100 is expected to open higher on Thursday, recovering from Wednesday's loss, ahead of the Bank of England's interest rate decision. US media reports suggest that Donald Trump will announce a trad…